Fig. 1
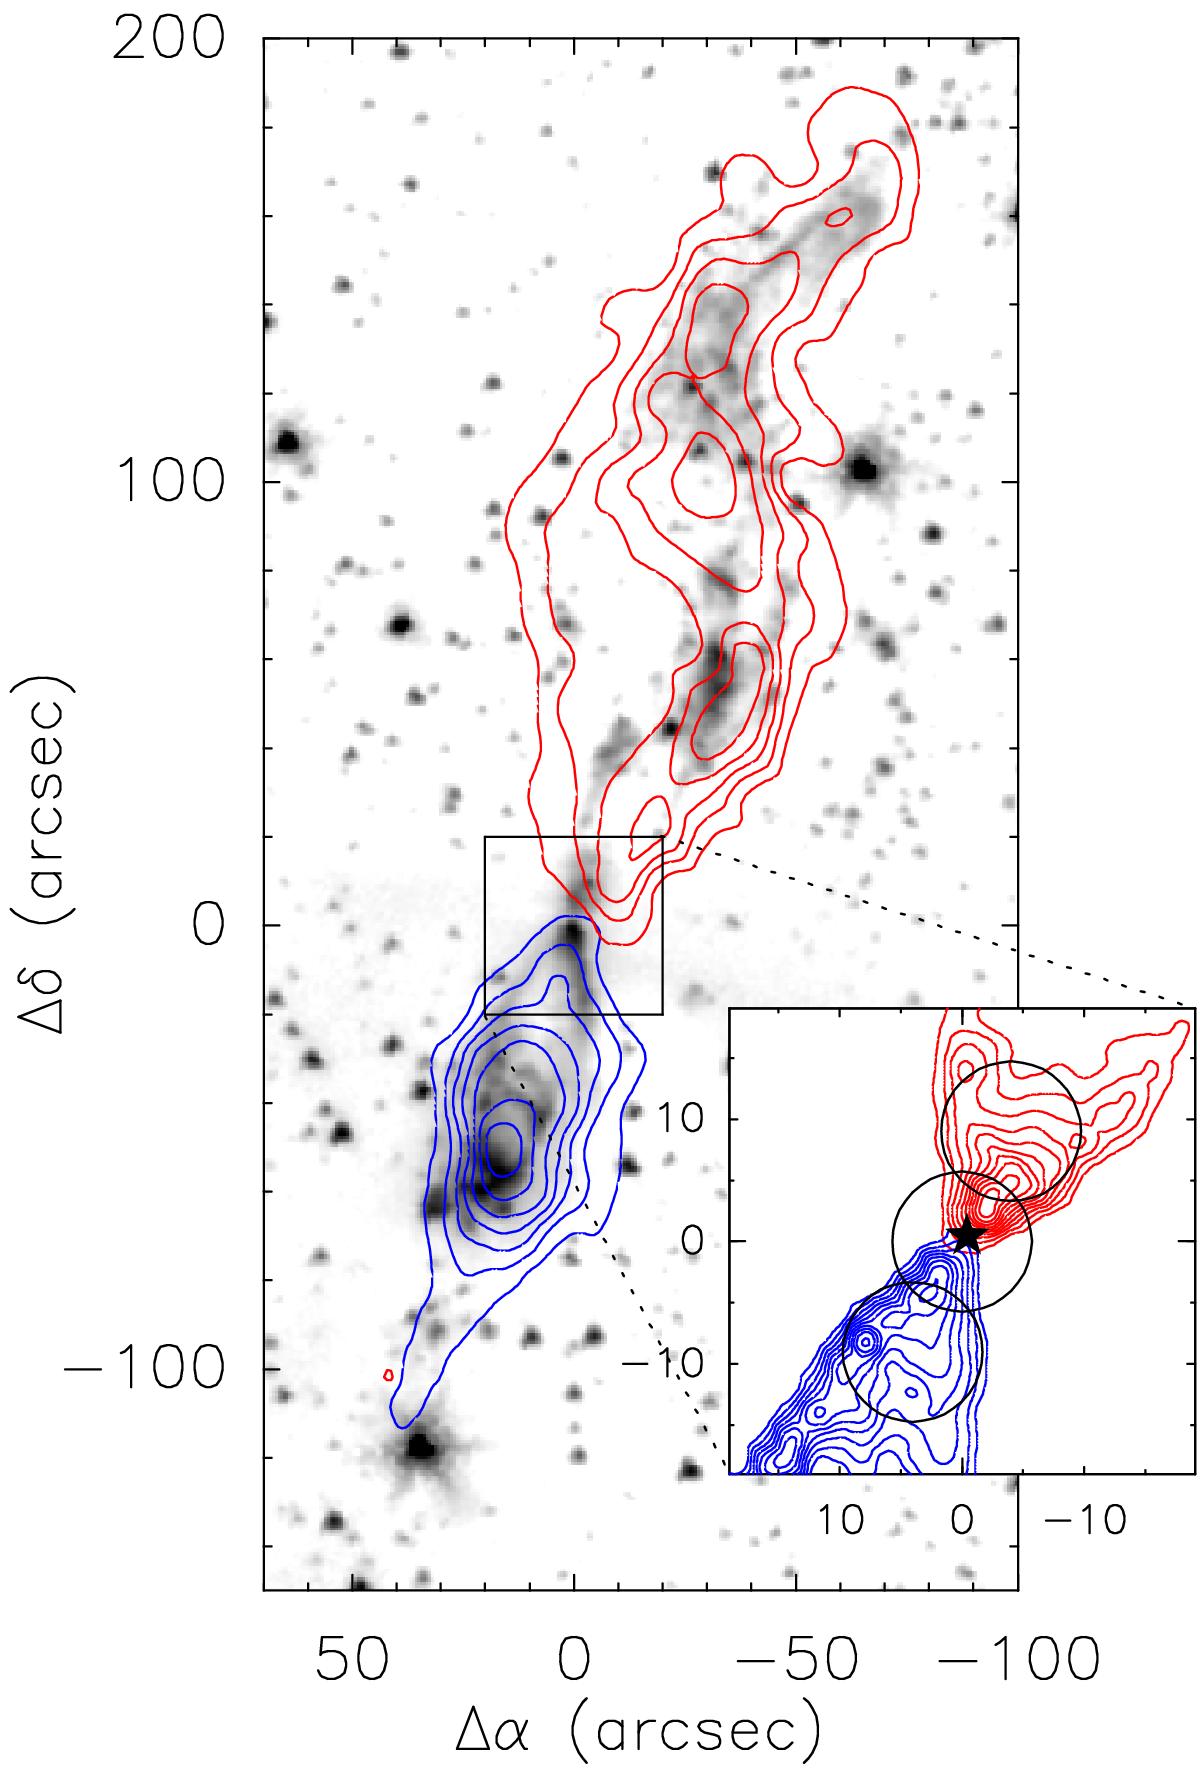
Large-scale view of the L1157 outflow. The main frame shows a superposition of the CO map from Bachiller et al. (2001) (contours) and the 3.6 μm Spitzer image of Looney et al. (2007). The inset shows the inner outflow according to the interferometric CO map of Jørgensen et al. (2007). The star symbol represents L1157-mm and the three circles represent the positions and beam sizes of our SiO(5–4) observations.
Current usage metrics show cumulative count of Article Views (full-text article views including HTML views, PDF and ePub downloads, according to the available data) and Abstracts Views on Vision4Press platform.
Data correspond to usage on the plateform after 2015. The current usage metrics is available 48-96 hours after online publication and is updated daily on week days.
Initial download of the metrics may take a while.