Fig. 9
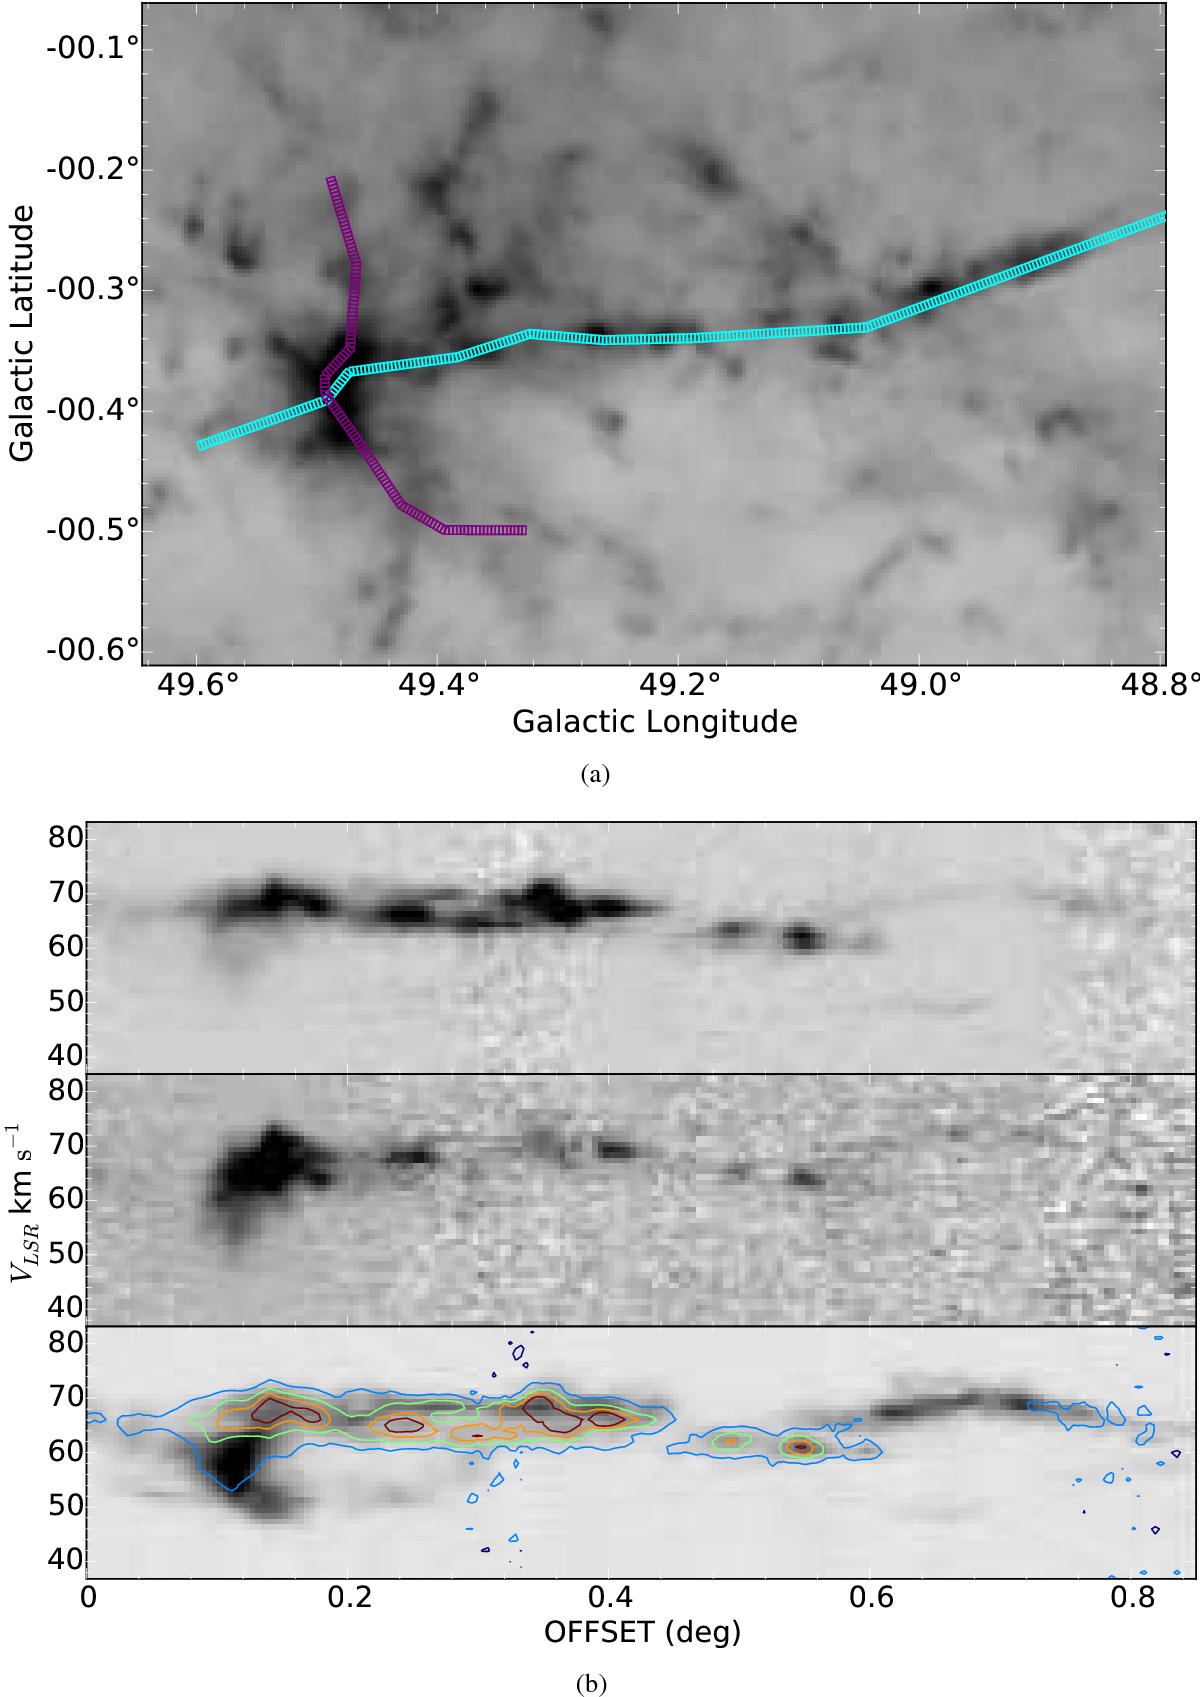
Top figure: a column density map fitted from the Herschel Hi-Gal data with two filament extraction regions superposed in cyan and purple. The purple extracted position-velocity diagram is shown in Fig. 10. Bottom figure: a position-velocity slice of the 68 km s-1 cloud, shown in cyan in the left figure, which includes an 8 μm-dark cloud and the interaction region with the W51C supernova remnant. (bottom figure, top panel) H2CO110 − 111 observed optical depth (bottom figure, middle panel) H2CO211 − 212 observed optical depth (bottom figure, bottom panel) 13CO 1−0 emission from the Galactic Ring Survey (GRS Jackson et al. 2006) with H2CO110 − 111 contours superposed. The weakness of the H2CO absorption on the right half of the cloud corroborates the geometry inferred from comparison of the 110 − 111 and 211 − 212 lines in Fig. 8. The 13CO emission without corresponding H2CO absorption at offset 0.2 degrees is primarily background material in the 51 km s-1 cloud (see Fig. 11. These figures were made using wcsaxes12 and pvextractor13).
Current usage metrics show cumulative count of Article Views (full-text article views including HTML views, PDF and ePub downloads, according to the available data) and Abstracts Views on Vision4Press platform.
Data correspond to usage on the plateform after 2015. The current usage metrics is available 48-96 hours after online publication and is updated daily on week days.
Initial download of the metrics may take a while.