Fig. 8
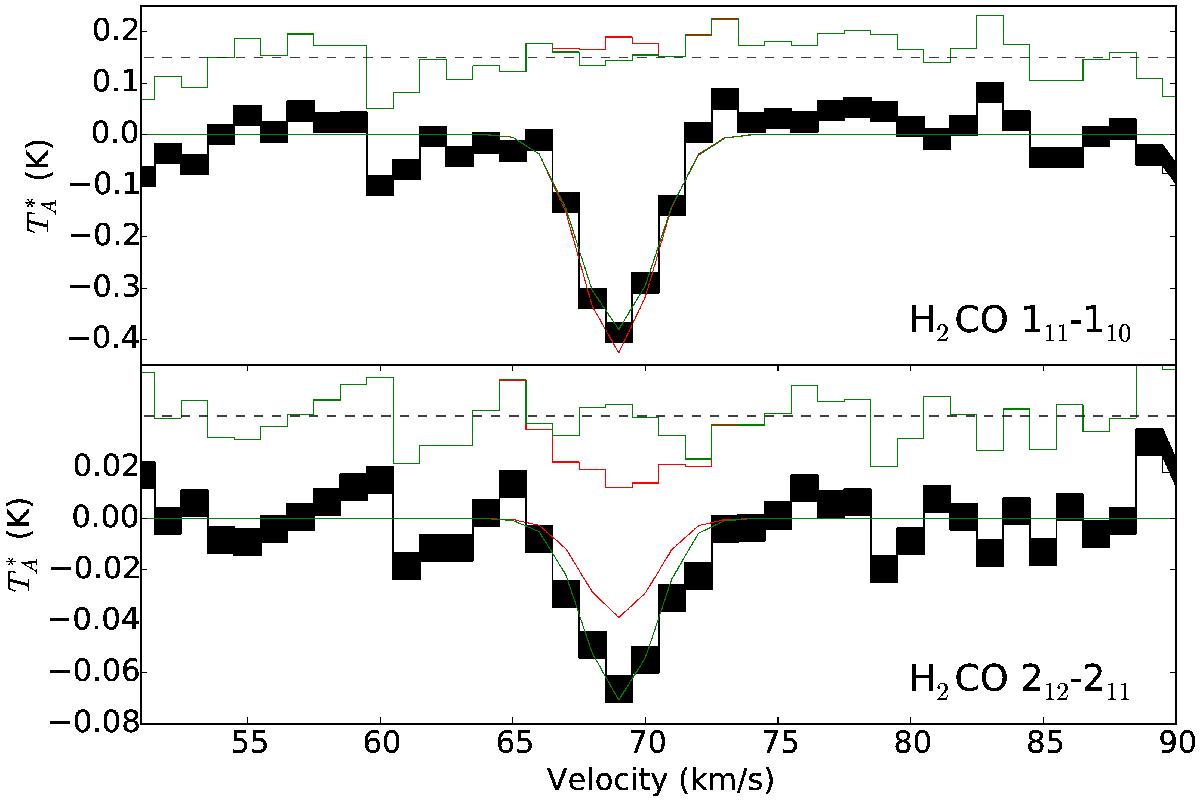
An example of the difference in models between a continuum source (red) and the CMB (green) as the background. The top plot shows the 110 − 111 line and the bottom shows the 211 − 212 line both with the continuum level set to zero in the plot. The residuals are shown offset above the spectra, with the dashed line indicating the zero-residual level. The grey shaded regions show the 1σ error bars on each pixel. The model with the CMB as the only background is able to reproduce the absorption line, while the model with the H ii region in the background cannot account for the depth of the 211 − 212 line. The reduced χ2/n for the models are 14.1 (red) and 2.8 (green), evaluated only over the pixels where the model is greater than the local rms.
Current usage metrics show cumulative count of Article Views (full-text article views including HTML views, PDF and ePub downloads, according to the available data) and Abstracts Views on Vision4Press platform.
Data correspond to usage on the plateform after 2015. The current usage metrics is available 48-96 hours after online publication and is updated daily on week days.
Initial download of the metrics may take a while.