Fig. 7
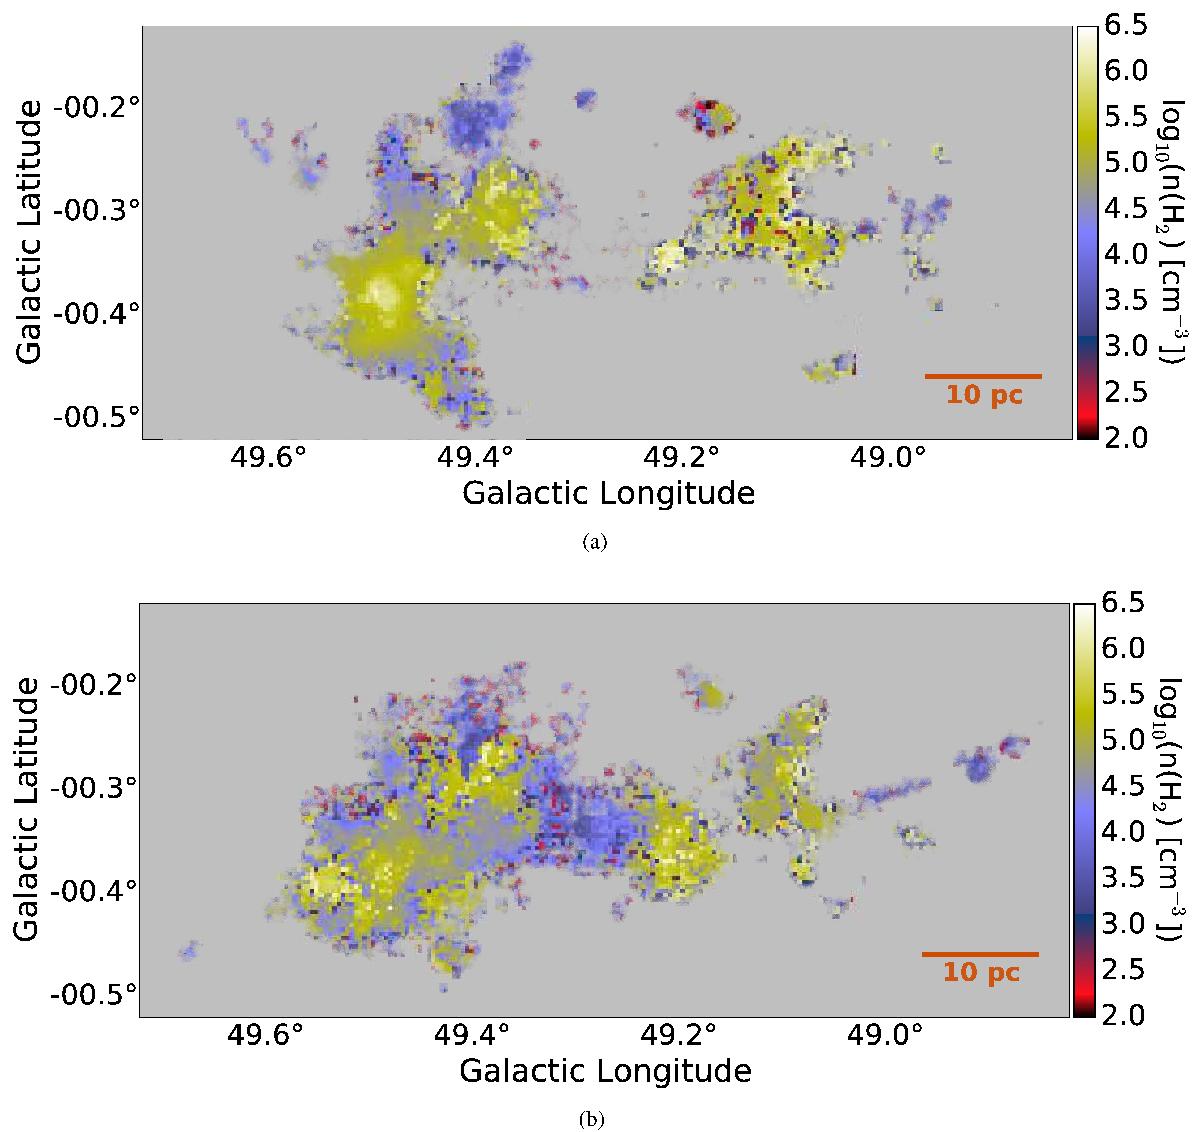
Map of the column-weighted volume density along the line of sight, split into a) the 40−62 km s-1 component and b) the 62 to 75 km s-1 component. The similarity between the two figures is due to large line widths; the cut at 62 km s-1 is meant to highlight the low-density filament around ℓ = 49 and the clouds surrounding W51 Main.
Current usage metrics show cumulative count of Article Views (full-text article views including HTML views, PDF and ePub downloads, according to the available data) and Abstracts Views on Vision4Press platform.
Data correspond to usage on the plateform after 2015. The current usage metrics is available 48-96 hours after online publication and is updated daily on week days.
Initial download of the metrics may take a while.