Free Access
Fig. 6
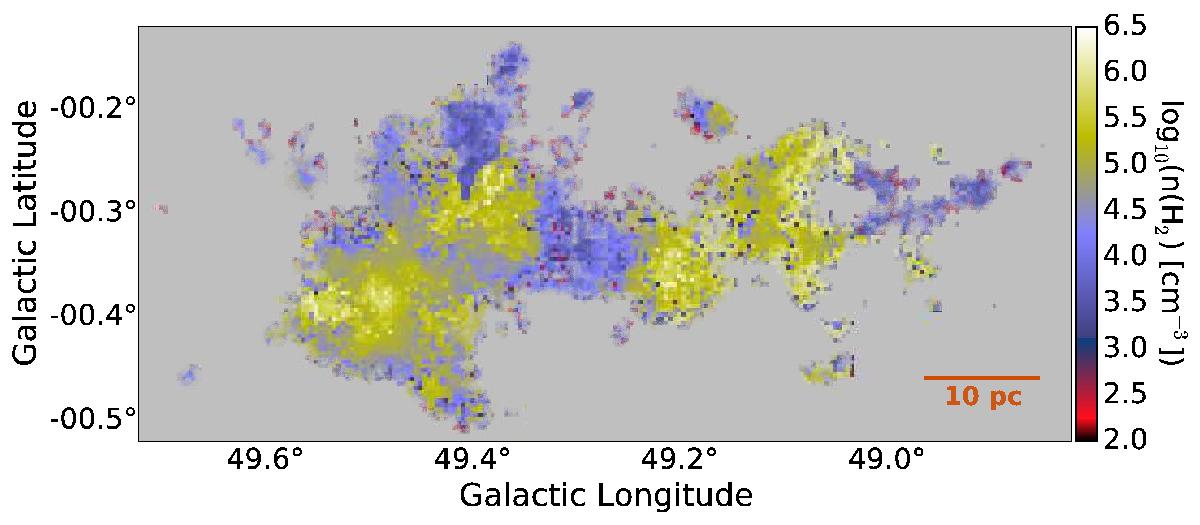
Map of the column-weighted volume density along the line of sight averaged over all velocities. The colors are greyed out where the S/N in the 110 − 111 line is less than ~ 7, with lower-signal regions being progressively more gray.
Current usage metrics show cumulative count of Article Views (full-text article views including HTML views, PDF and ePub downloads, according to the available data) and Abstracts Views on Vision4Press platform.
Data correspond to usage on the plateform after 2015. The current usage metrics is available 48-96 hours after online publication and is updated daily on week days.
Initial download of the metrics may take a while.