Fig. 3
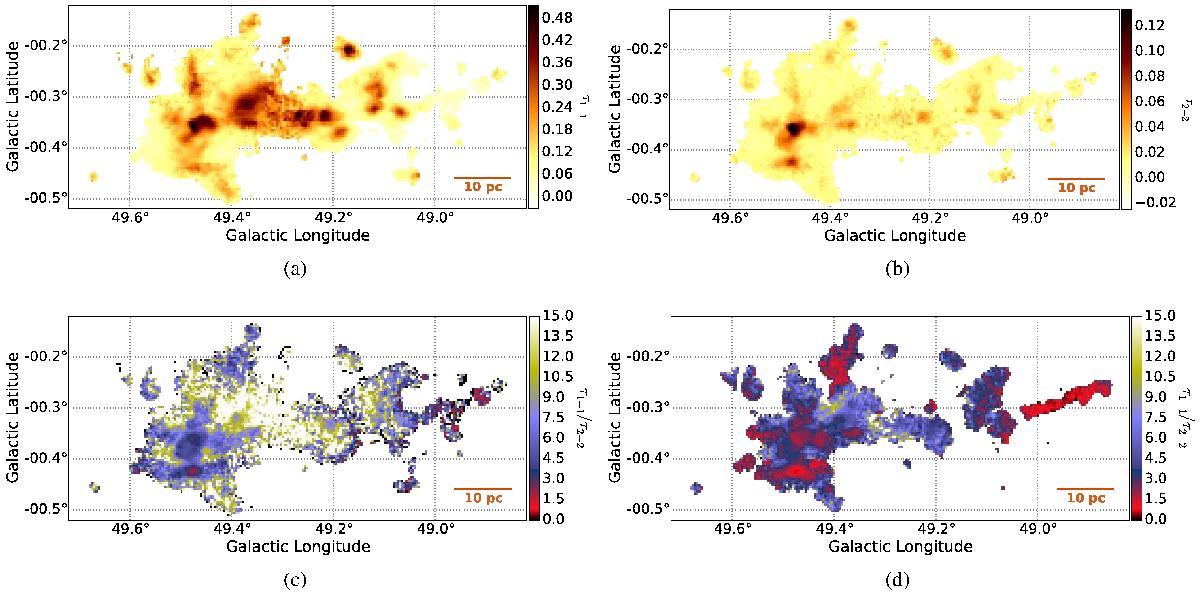
Peak observed optical depth τobs = −ln(TMB/Tcontinuum) in the a) 110 − 111 and b) 211 − 212 lines and c) their ratio, 110 − 111/211 − 212. Figure d) shows the true optical depth ratio assuming Tex(110 − 111) = 1.0 K and Tex(211 − 212) = 1.5 K; these are reasonable and representative excitation temperatures but they are not fits to the data. The data are masked with a filter described in Sect. 3.2 and cover the range 75 >VLSR> 40 km s-1; see Figs. 4 and 5 for individual velocity components. In general, lower (redder) ratios in Figs. c) and d) indicate higher densities, however in the filament at 49.0−0.3, the low ratio is due to the geometry in which Tcontinuum is in the foreground of the molecular gas.
Current usage metrics show cumulative count of Article Views (full-text article views including HTML views, PDF and ePub downloads, according to the available data) and Abstracts Views on Vision4Press platform.
Data correspond to usage on the plateform after 2015. The current usage metrics is available 48-96 hours after online publication and is updated daily on week days.
Initial download of the metrics may take a while.