Free Access
Fig. B.2
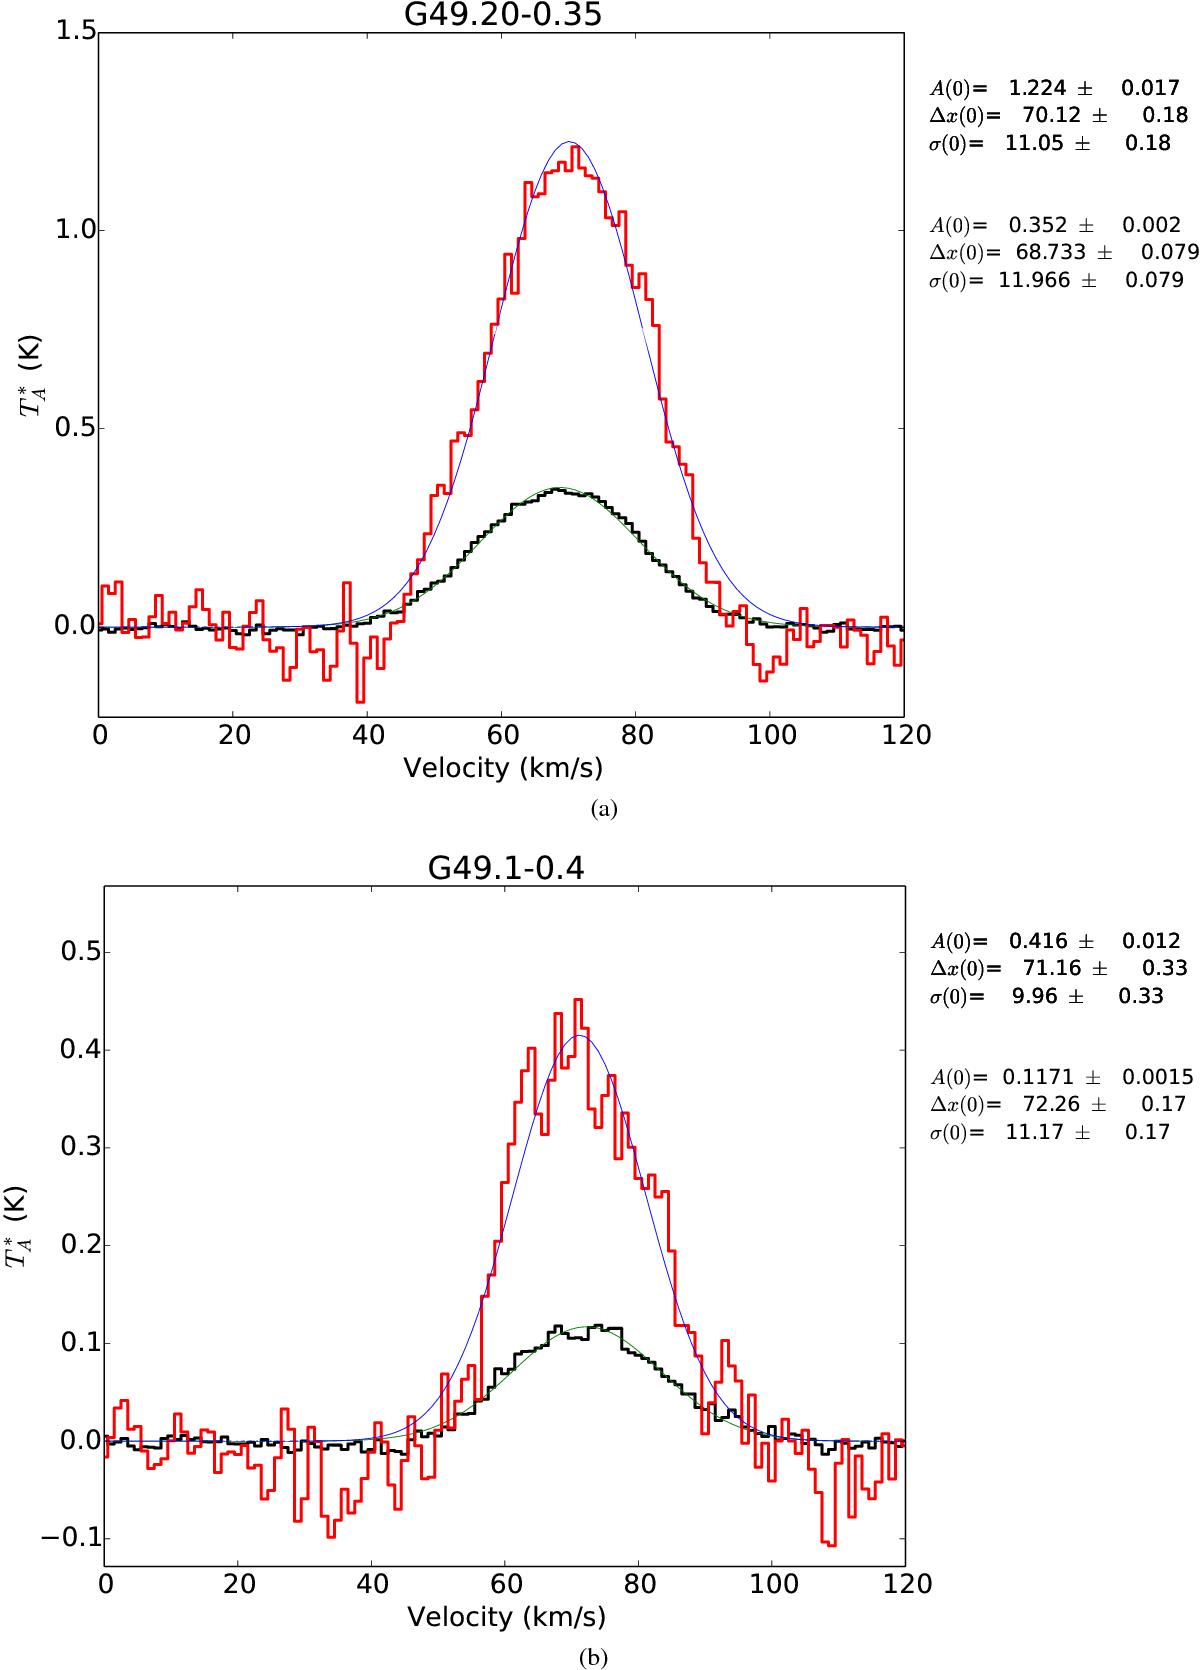
Fitted H110α (red) and H77α (black) spectra extracted from 55′′ apertures centered on G49.20-0.35 (top) and G49.1-0.4 (bottom). The best-fit Gaussian parameters are shown in the legends, with the lower legend corresponding to H77α.
This figure is made of several images, please see below:
Current usage metrics show cumulative count of Article Views (full-text article views including HTML views, PDF and ePub downloads, according to the available data) and Abstracts Views on Vision4Press platform.
Data correspond to usage on the plateform after 2015. The current usage metrics is available 48-96 hours after online publication and is updated daily on week days.
Initial download of the metrics may take a while.