Fig. A.5
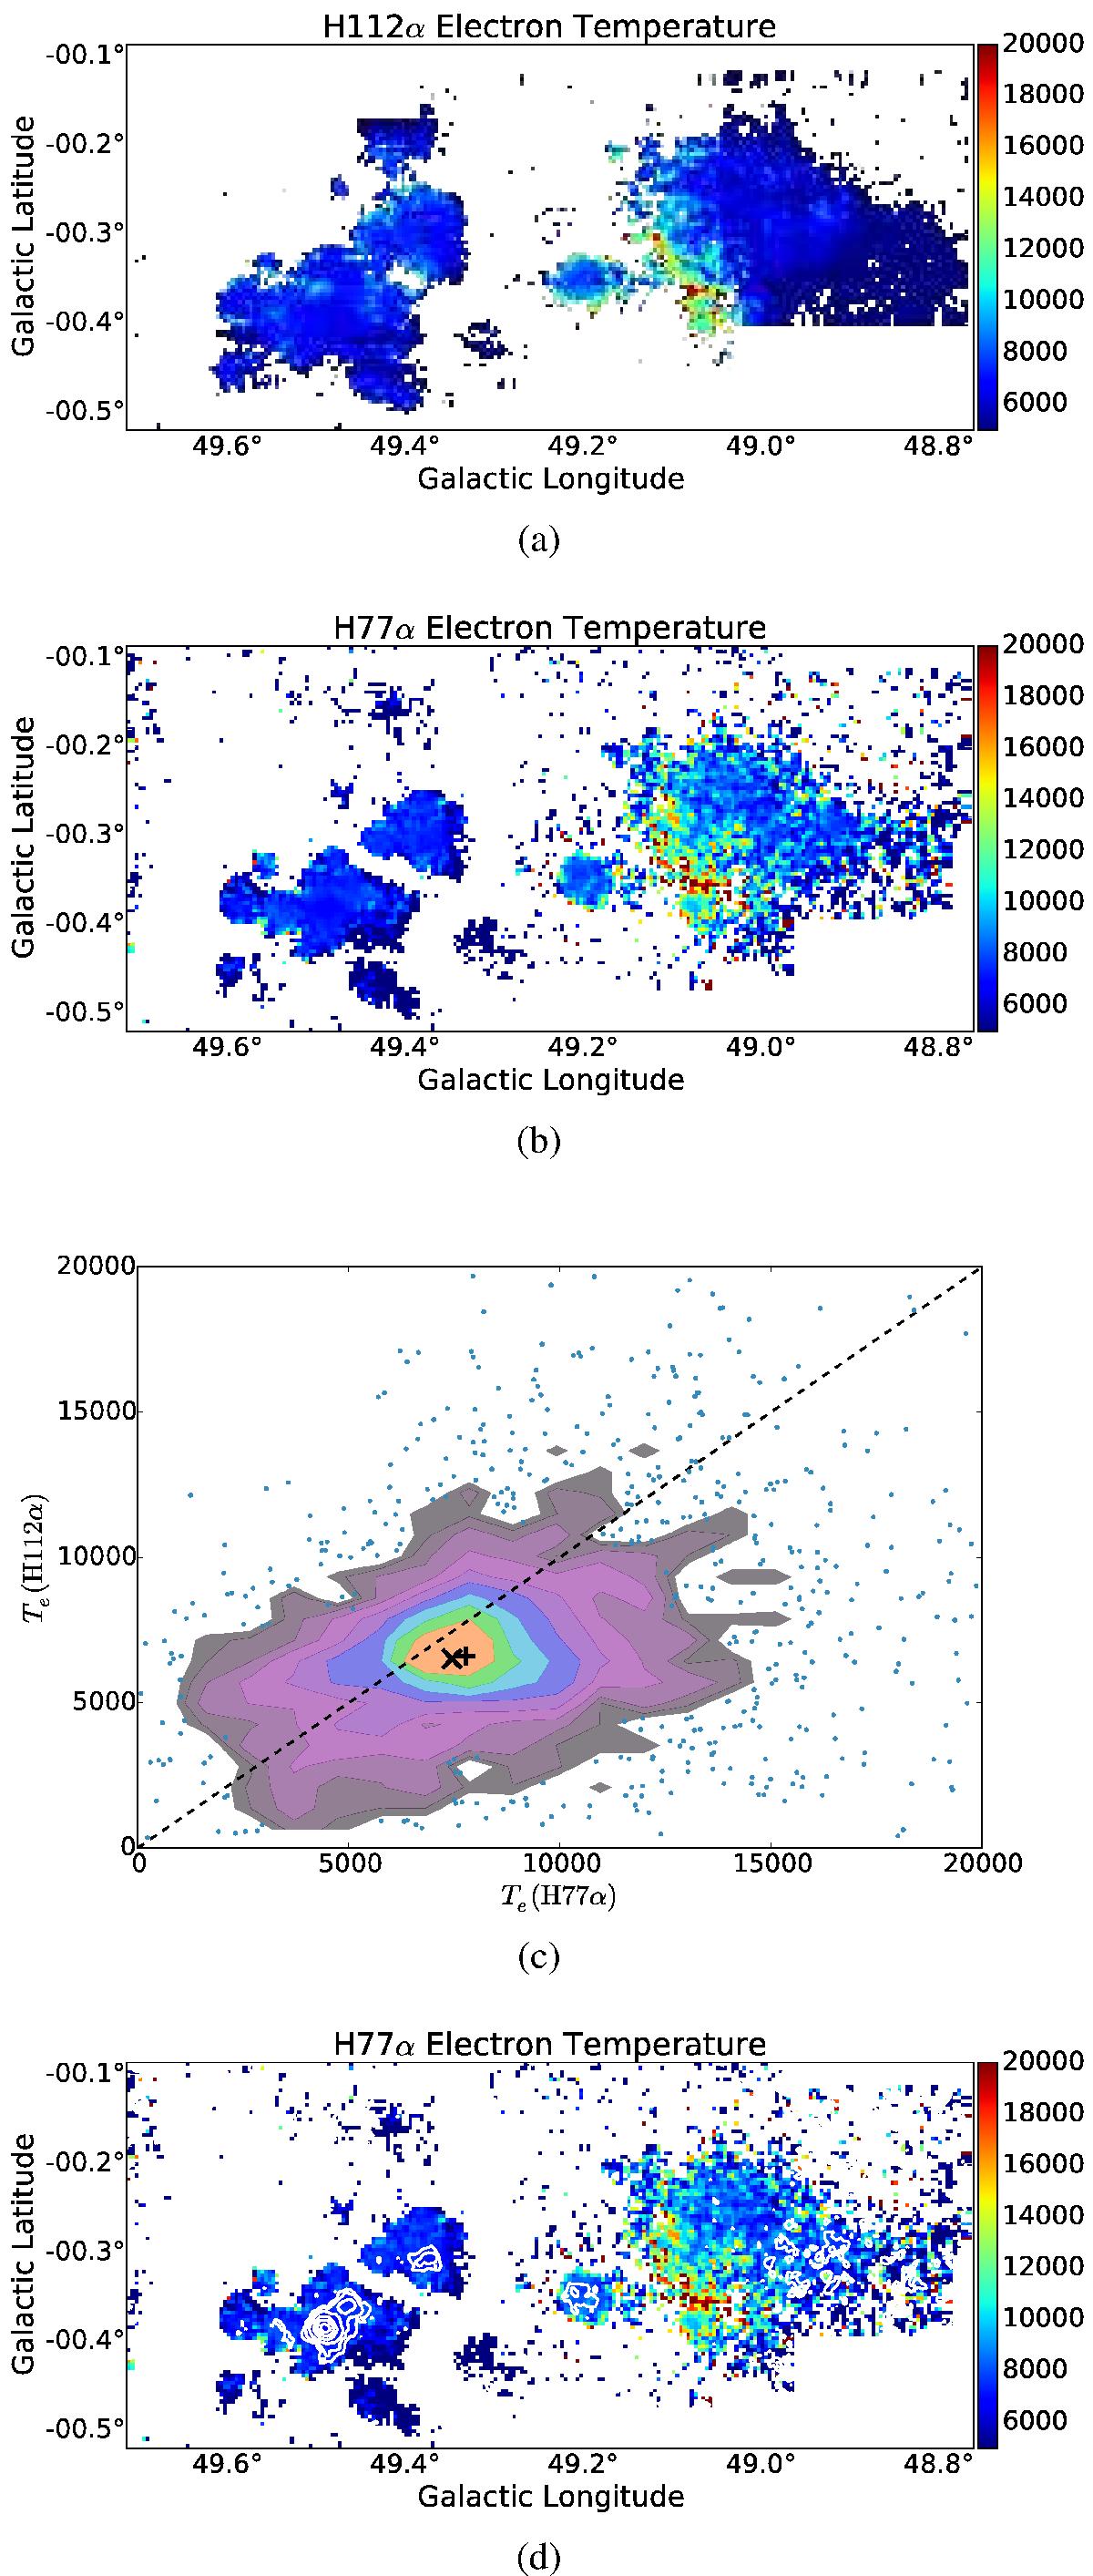
a) H112α electron temperature map showing ![]() in K. b) H77α electron temperature map showing
in K. b) H77α electron temperature map showing ![]() in K. c) Measured electron temperature in the 6 cm vs. the 2 cm band at each spatial pixel with significant detected RRL emission. The contours show regions of increasing pixel density. The x marks the median and the + marks the mean over all valid pixels. d) Same as b), but with integrated He77α contours at levels [0.0125, 0.025, 0.05, 0.1, 0.15, 0.2] K km s-1 overlaid. The contours on the right side (ℓ< 49) most likely trace noise, since the noise in that region is higher.
in K. c) Measured electron temperature in the 6 cm vs. the 2 cm band at each spatial pixel with significant detected RRL emission. The contours show regions of increasing pixel density. The x marks the median and the + marks the mean over all valid pixels. d) Same as b), but with integrated He77α contours at levels [0.0125, 0.025, 0.05, 0.1, 0.15, 0.2] K km s-1 overlaid. The contours on the right side (ℓ< 49) most likely trace noise, since the noise in that region is higher.
Current usage metrics show cumulative count of Article Views (full-text article views including HTML views, PDF and ePub downloads, according to the available data) and Abstracts Views on Vision4Press platform.
Data correspond to usage on the plateform after 2015. The current usage metrics is available 48-96 hours after online publication and is updated daily on week days.
Initial download of the metrics may take a while.