Fig. A.4
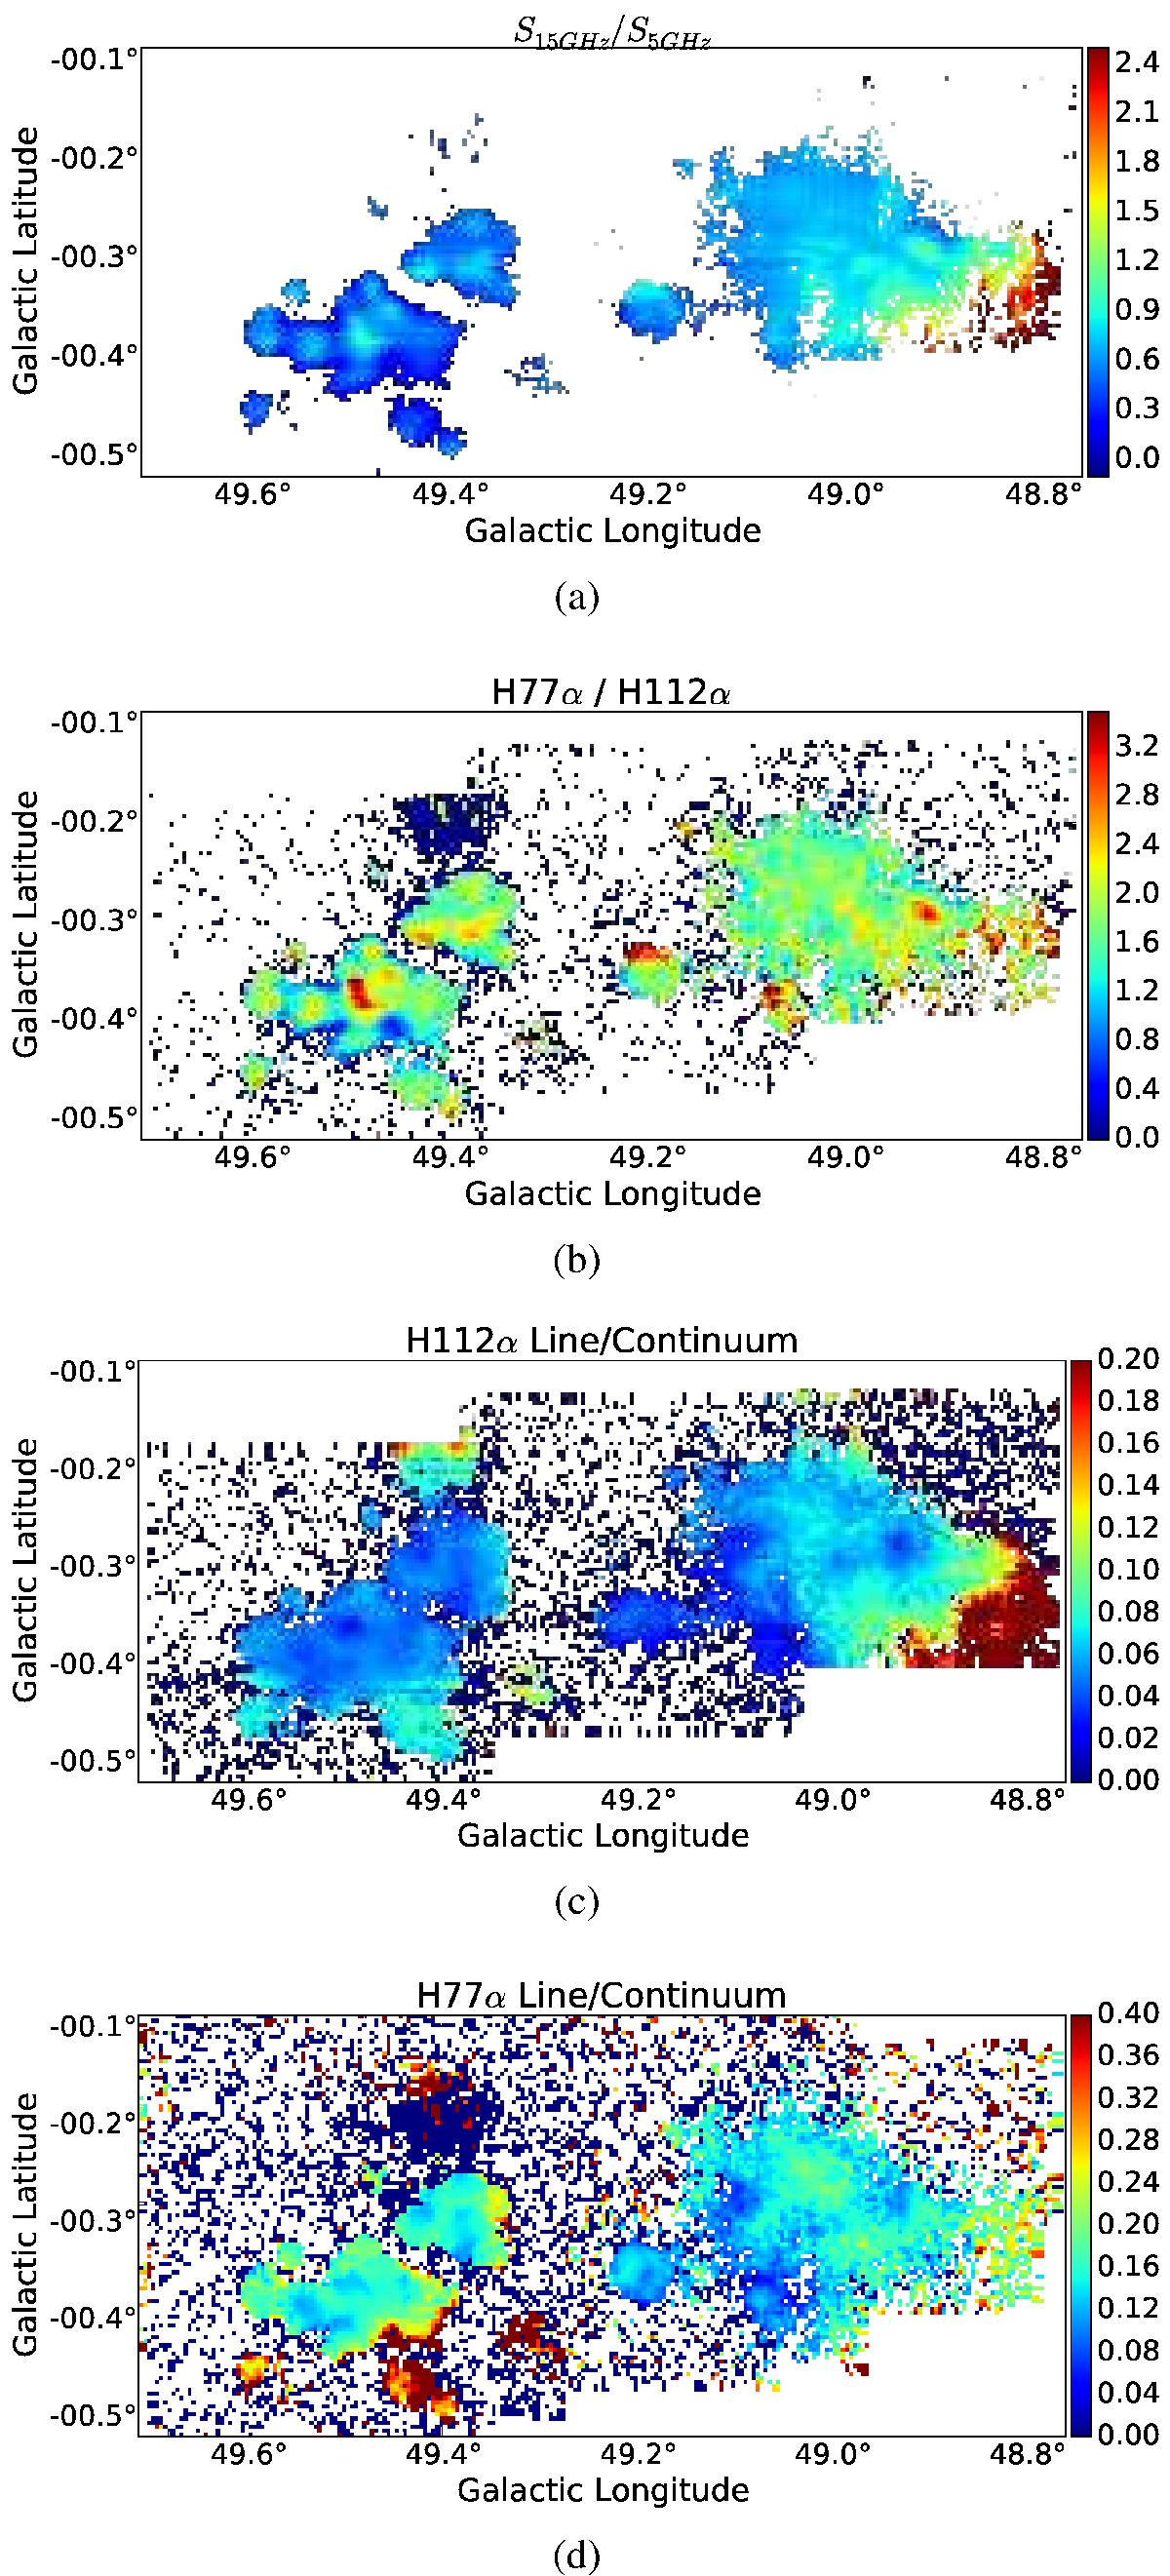
Ratio maps of the ionized gas in W51. a) Continuum ratio S15 GHz/S5 GHz. For α = −0.1, an optically thin free-free source, the ratio is 0.9, while for α = 2, an optically thick source, the ratio is 9. b) The ratio of the H77α peak to the H112α peak. c) The line-to-continuum ratio H112α/S5 GHz. d) The line-to-continuum ratio H77α/S15 GHz.
Current usage metrics show cumulative count of Article Views (full-text article views including HTML views, PDF and ePub downloads, according to the available data) and Abstracts Views on Vision4Press platform.
Data correspond to usage on the plateform after 2015. The current usage metrics is available 48-96 hours after online publication and is updated daily on week days.
Initial download of the metrics may take a while.