Fig. A.2
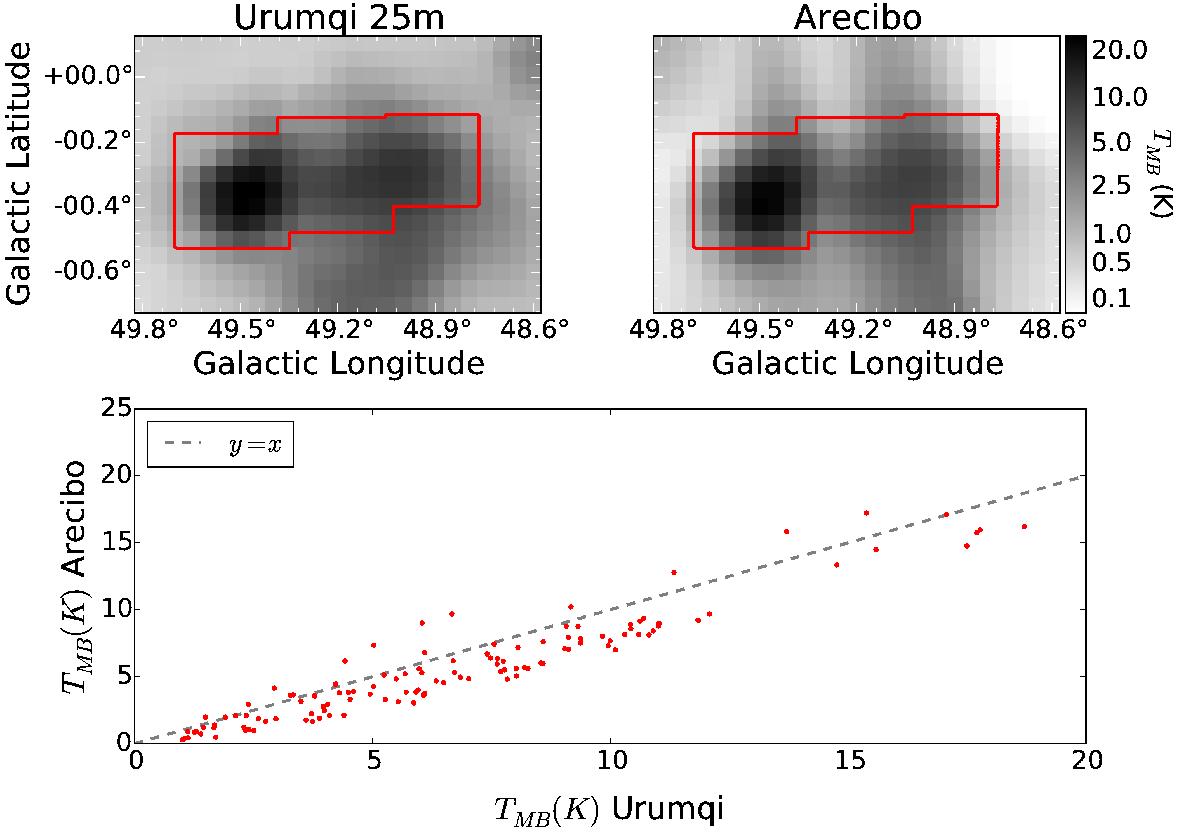
Comparison between the Arecibo and Urumqi 25 m (Sun et al. 2011b) data. Top left: Urumqi 6 cm map of the W51 region. Top right: Arecibo 6 cm map of the same region smoothed to the 9.5′ resolution of the Urumqi data set. The colorbar applies to both figures, showing brightness temperature units in K. The red contours in both figures show the region observed by Arecibo; flux outside of those boundaries is extrapolated with the smoothing kernel. Bottom: plot of the Arecibo vs. the Urumqi surface brightness measurements. The red dots show the region within the red contours.
Current usage metrics show cumulative count of Article Views (full-text article views including HTML views, PDF and ePub downloads, according to the available data) and Abstracts Views on Vision4Press platform.
Data correspond to usage on the plateform after 2015. The current usage metrics is available 48-96 hours after online publication and is updated daily on week days.
Initial download of the metrics may take a while.