Fig. 16
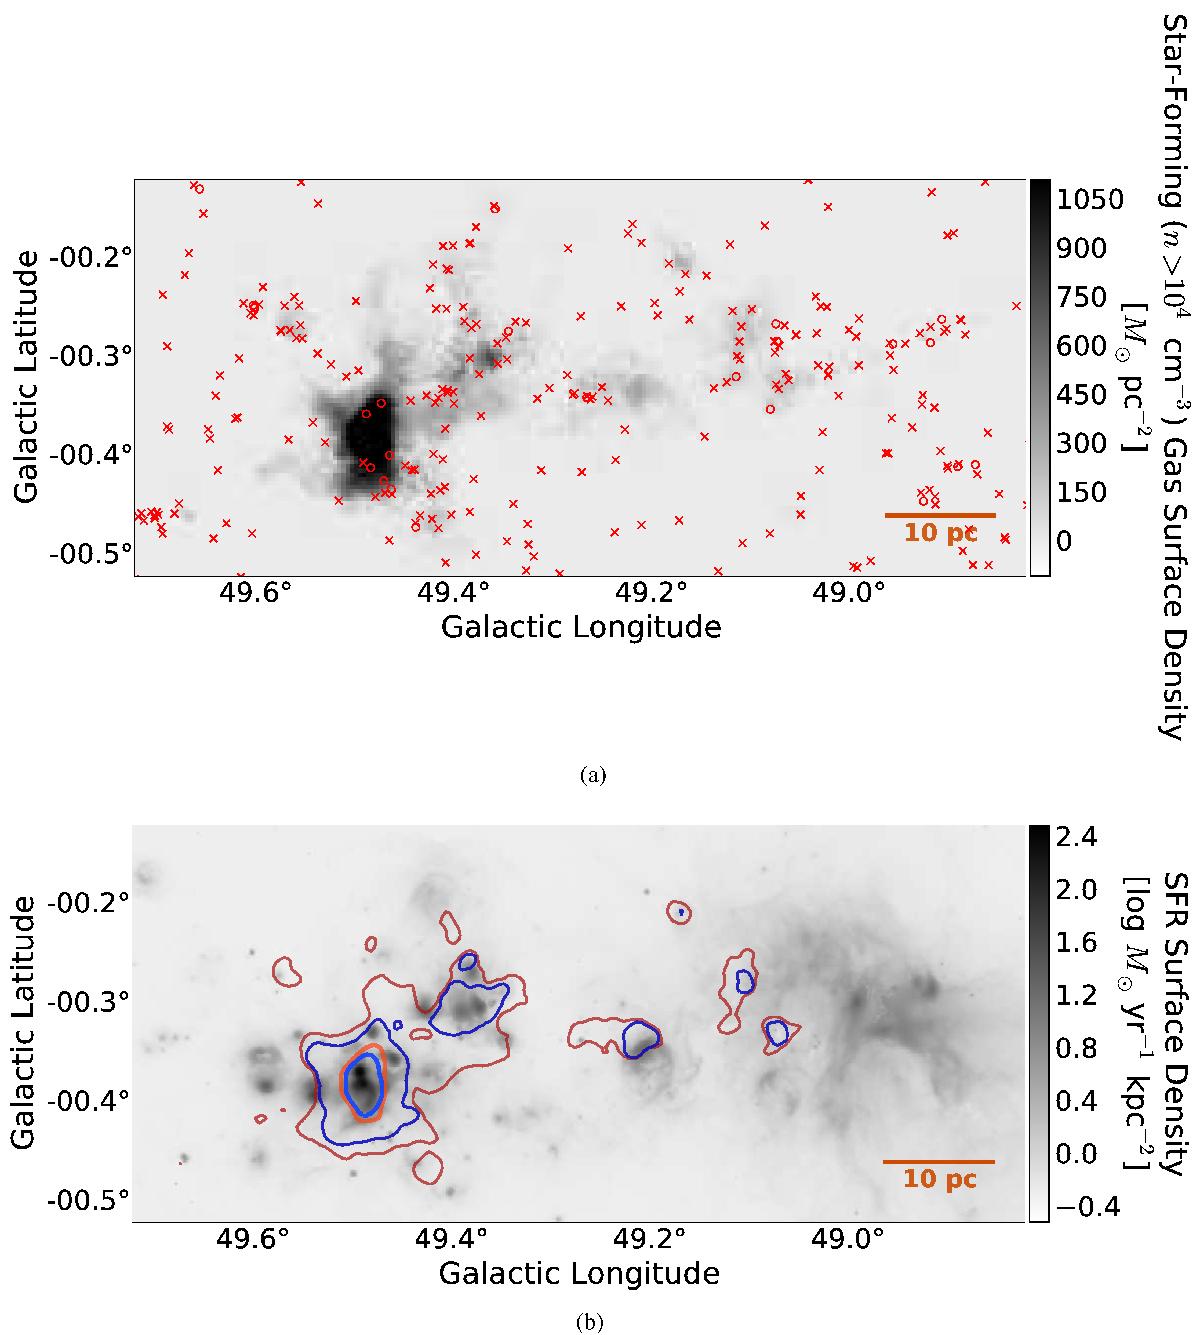
Top: a star-forming gas mass map, created by multiplying the dense gas fraction by the integrated 13CO mass surface density. The red symbols are Class I and flat-spectrum YSOs from Kang et al. (2009) with M< 10 M⊙ (×’s) and M> 10 M⊙ (circles). They are absent from the highest density regions. Bottom: a star formation rate surface density map computed from the MSX 21 cm and MIPS 24 μm (Price et al. 2001; Carey et al. 2009) data with a star formation rate computed using the Rieke et al. (2009) calibration (Kennicutt & Evans 2012). The contours show the star-forming gas surface density above a threshold n> 104cm-3 (red) and n> 105cm-3 (blue) at levels of [100,1000] M⊙ kpc-2. At low star-forming gas surface density, the star formation surface density is essentially anticorrelated with the gas surface density. The two converge at the highest surface densities and at the highest volume densities.
Current usage metrics show cumulative count of Article Views (full-text article views including HTML views, PDF and ePub downloads, according to the available data) and Abstracts Views on Vision4Press platform.
Data correspond to usage on the plateform after 2015. The current usage metrics is available 48-96 hours after online publication and is updated daily on week days.
Initial download of the metrics may take a while.