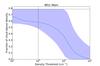
Fig. 14
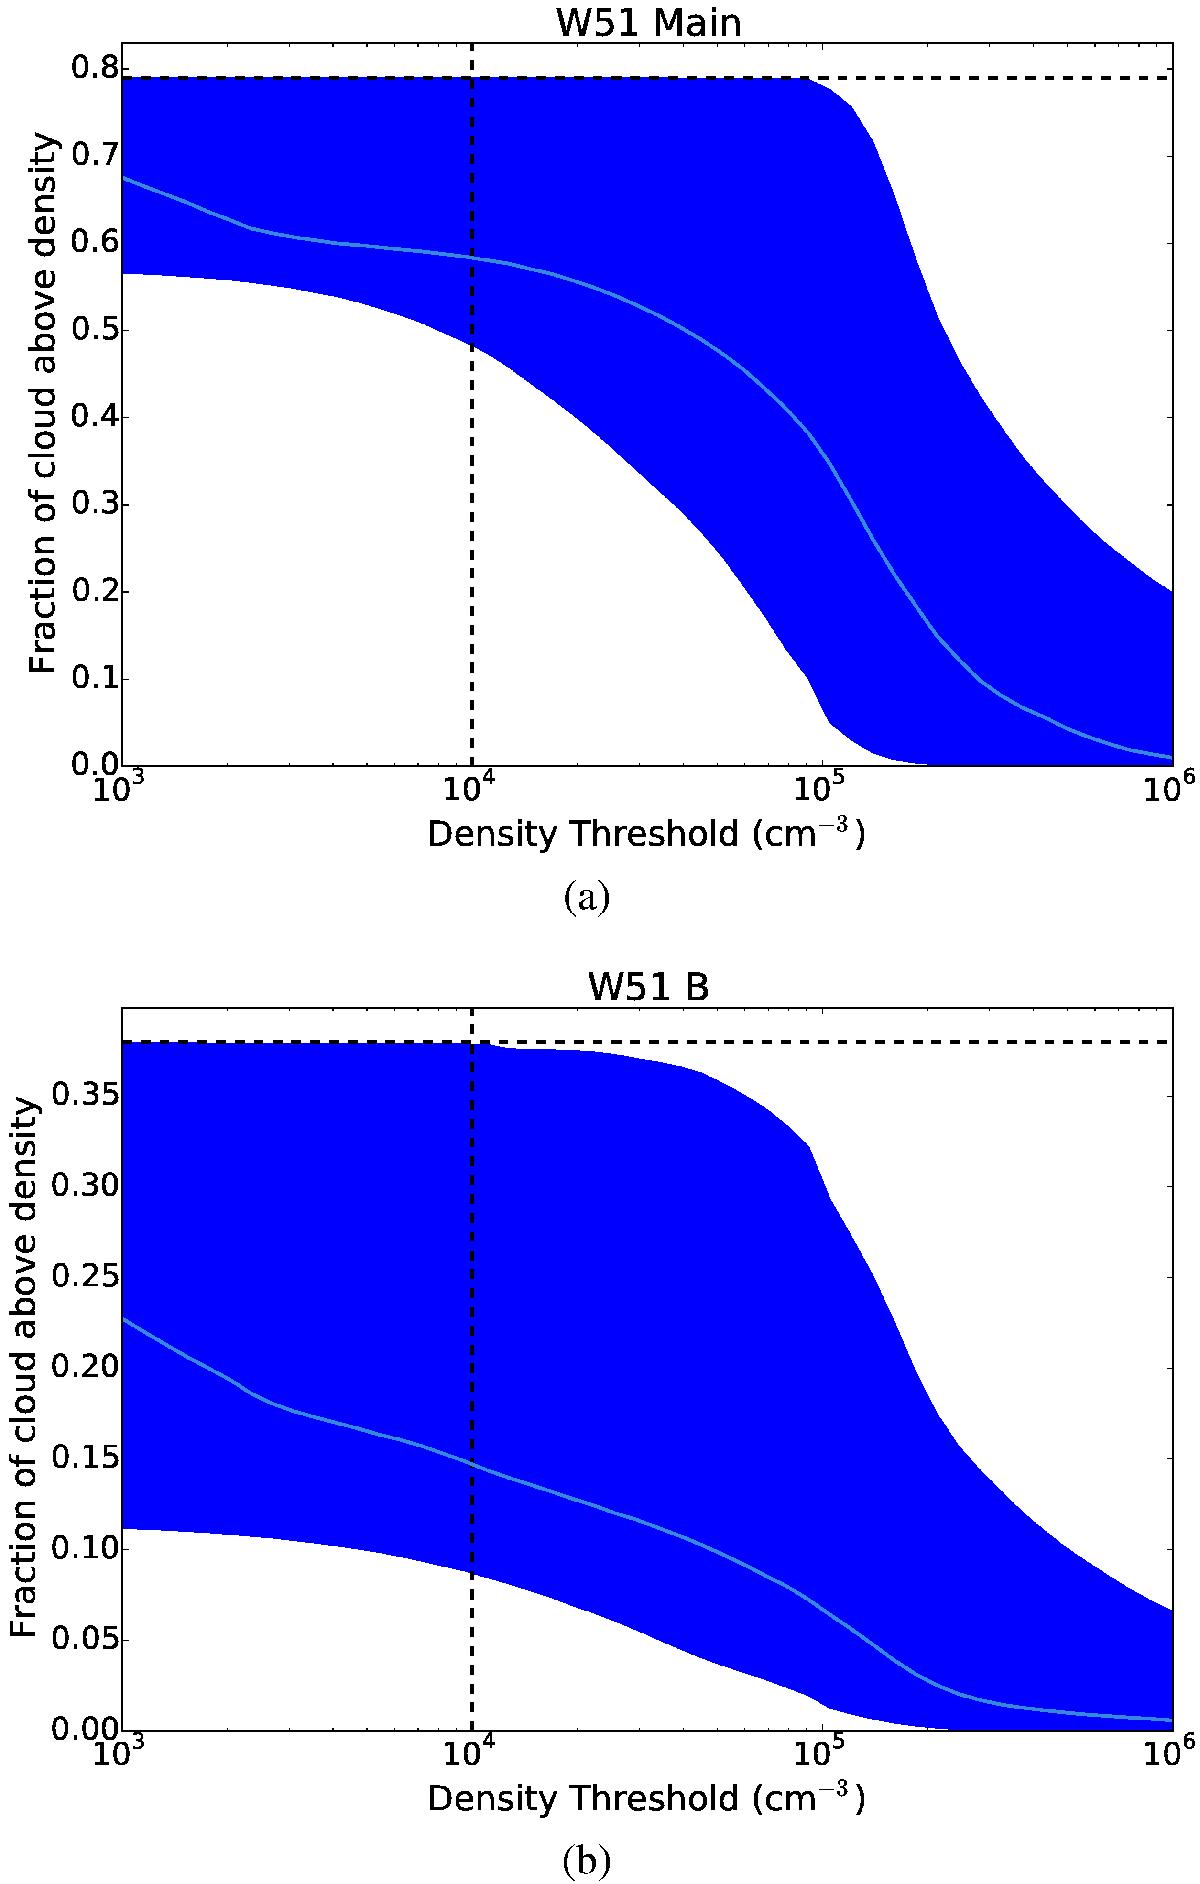
Same as Fig. 13, but for two individual regions: W51 Main a), the region 49.4°<ℓ< 49.6°, − 0.5°<b< − 0.3°, and W51 B b) with 48.8°ℓ< 49.4° and − 0.5°<b< − 0.1°. Note that the y axes have different ranges. The area covered by the W51 B cutout is 6 × larger than the W51 A cutout, so its effect on Fig. 13 is greater. The total area covered in Fig. 13 includes some regions with no detected H2CO, which is why the peak fraction in that figure is lower.
Current usage metrics show cumulative count of Article Views (full-text article views including HTML views, PDF and ePub downloads, according to the available data) and Abstracts Views on Vision4Press platform.
Data correspond to usage on the plateform after 2015. The current usage metrics is available 48-96 hours after online publication and is updated daily on week days.
Initial download of the metrics may take a while.