Fig. 13
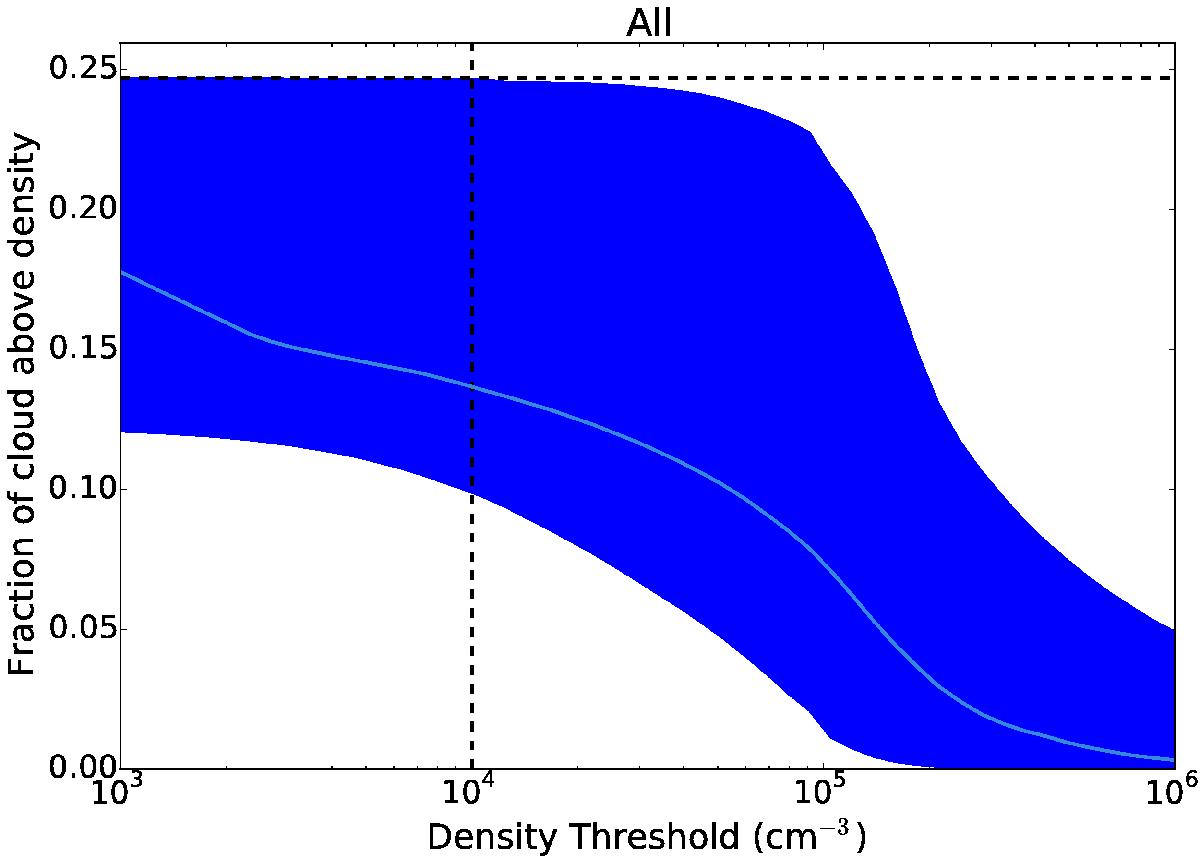
Dense gas mass fraction as a function of volume density threshold n(H2)cm-3. The y-axis shows the sum of 13CO pixels from the GRS cube with H2CO-derived density above the value shown on the x-axis divided by the total. Both values are computed over the velocity range 40 km s-1<vLSR< 75 km s-1. The solid line represents the fraction of 13CO emitting voxels above the mean measured H2CO density as described in Sect. 3.3. The blue shaded region shows the extent of plausible model fits at each density: effectively, this is the ~ 1σ error region. The vertical line at n = 104cm-3 indicates the approximate completeness limit. The horizontal line shows the fraction of 13CO flux in pixels that had corresponding detections at > 2σ in both the H2CO110 − 111 and 211 − 212 lines: it represents the upper limit of what could have been detected if, e.g., all H2CO detections were toward regions with n> 104cm-3. The failure to converge to a fraction f → fmax indicates that there are some real detections of low-density gas.
Current usage metrics show cumulative count of Article Views (full-text article views including HTML views, PDF and ePub downloads, according to the available data) and Abstracts Views on Vision4Press platform.
Data correspond to usage on the plateform after 2015. The current usage metrics is available 48-96 hours after online publication and is updated daily on week days.
Initial download of the metrics may take a while.