Fig. 11
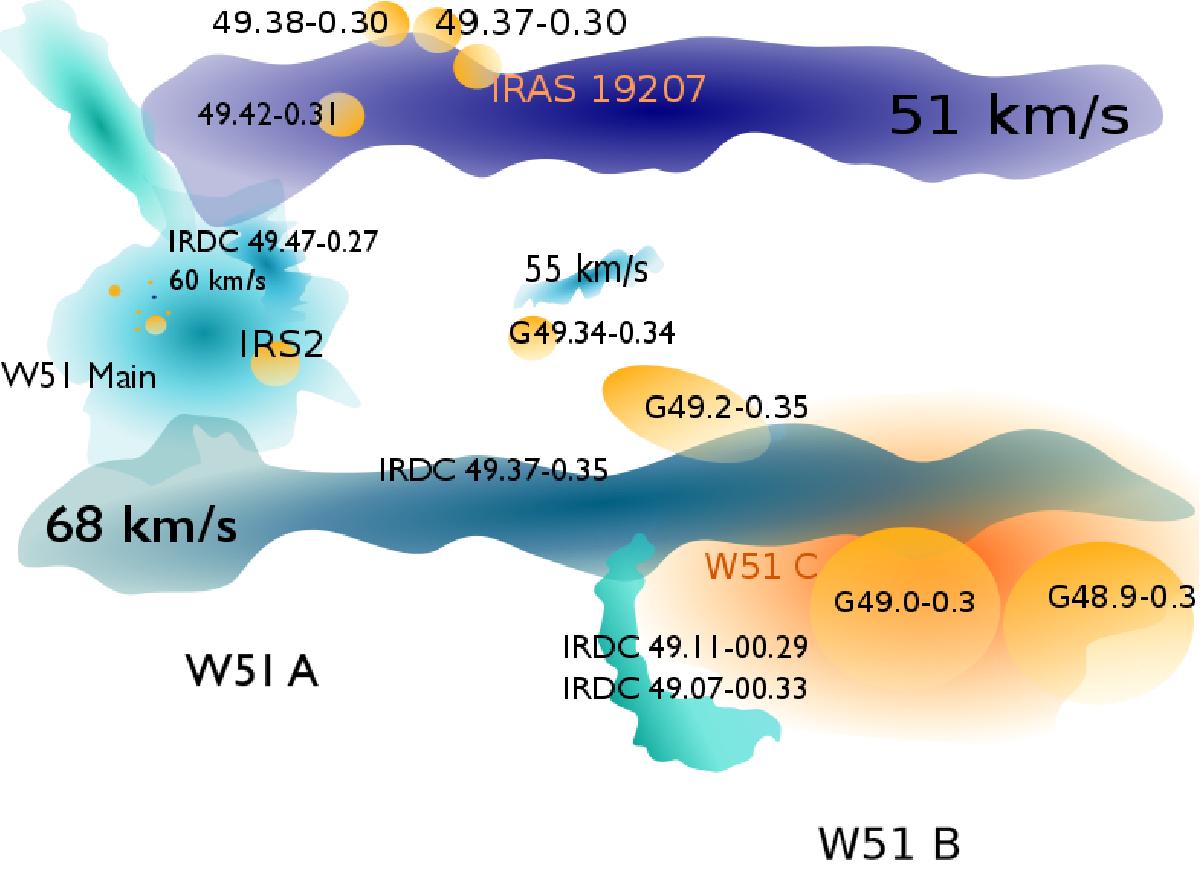
A sketched diagram of the W51 region as viewed from the Galactic north pole, with the observer looking up the page from the bottom (i.e., W51C is the front-most labeled object along our line-of-sight). There are a few significant differences between this and Fig. 29 of Kang et al. (2010), particularly the relative geometry of the cloud and the H ii regions in W51 B. We also show a good deal more detail, revealing that there are H ii regions on both front and back of many clouds. The orange areas represent H ii regions and ionized gas (the W51 C SNR), while purple/blue/cyan regions show molecular clouds. The shapes of the clouds approximately reflect their shape on the sky, but these shapes are only intended as mnemonics to help associate this face-on view with the edge-on view of the real observations. Figure 12 shows the face-on view and can be compared side-by-side with this figure to get an approximate 3D view of the region.
Current usage metrics show cumulative count of Article Views (full-text article views including HTML views, PDF and ePub downloads, according to the available data) and Abstracts Views on Vision4Press platform.
Data correspond to usage on the plateform after 2015. The current usage metrics is available 48-96 hours after online publication and is updated daily on week days.
Initial download of the metrics may take a while.