Free Access
Fig. 9
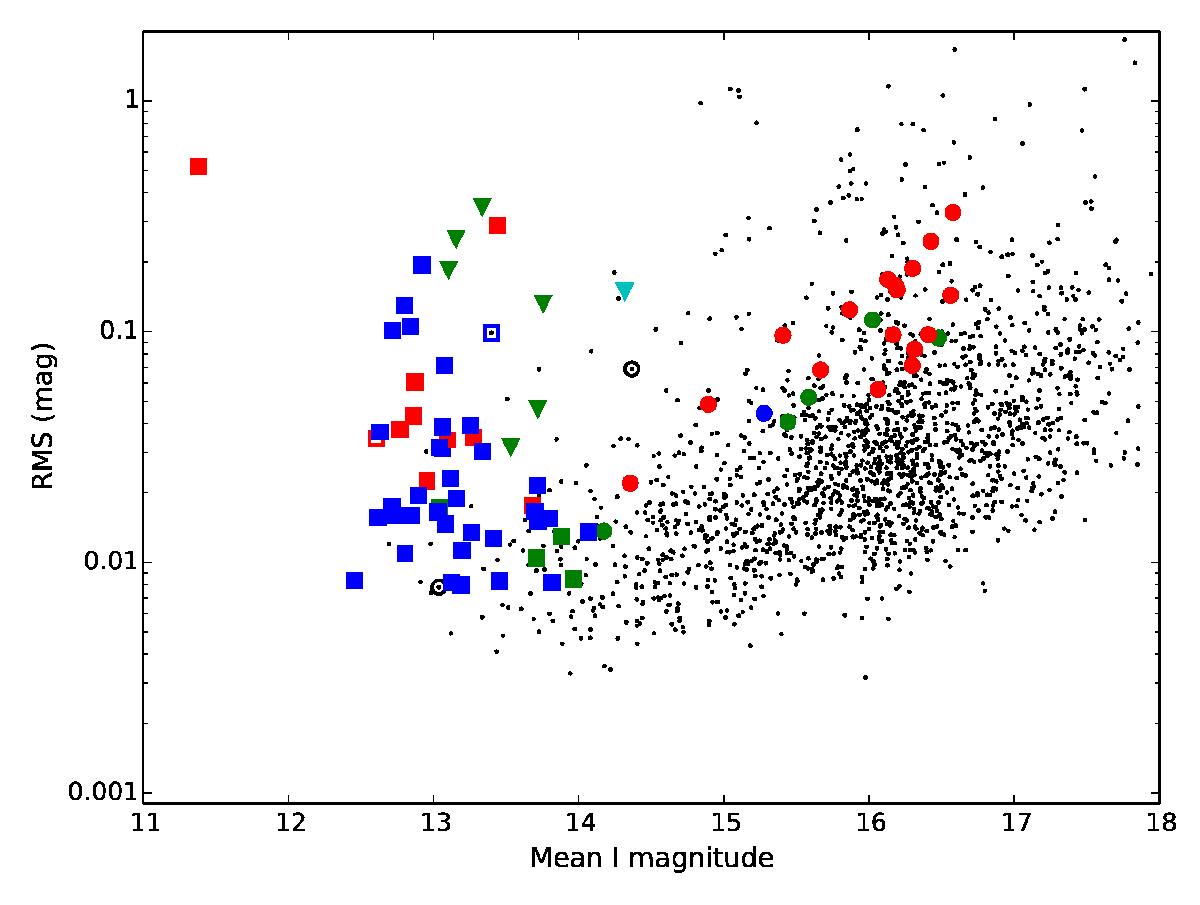
NGC 6441: plot of the rms magnitude deviation versus the mean magnitude for each of the 1860 calibrated I light curves. The variables are plotted with the same symbols as in Fig. 3.
Current usage metrics show cumulative count of Article Views (full-text article views including HTML views, PDF and ePub downloads, according to the available data) and Abstracts Views on Vision4Press platform.
Data correspond to usage on the plateform after 2015. The current usage metrics is available 48-96 hours after online publication and is updated daily on week days.
Initial download of the metrics may take a while.