Free Access
Fig. 19
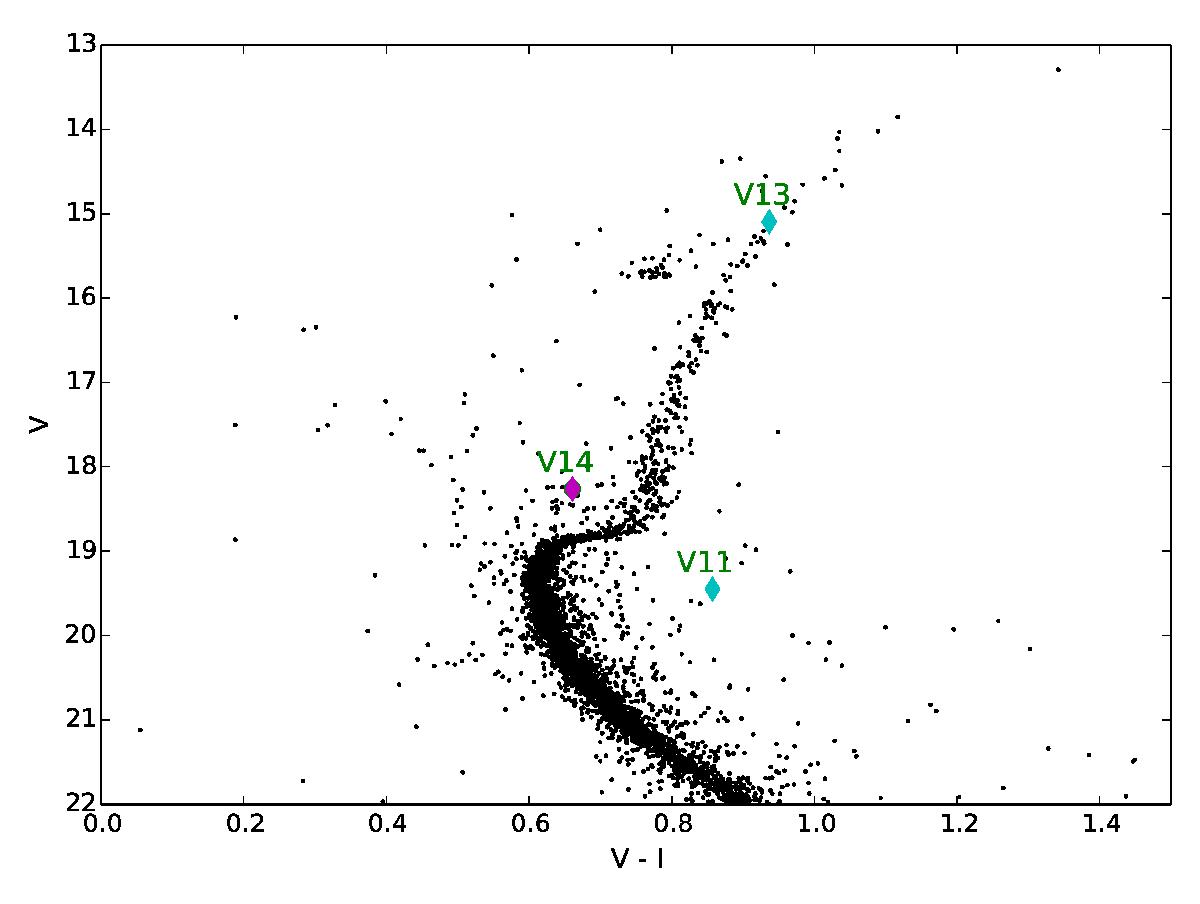
NGC 6652: (V − I),V colour–magnitude diagram made from HST/ACS data as explained in Sect. 2.6. The three stars that show variability in our study are plotted. The two previously known X-ray sources are marked as cyan diamonds and the new found RR1 is marked with a green circle.
Current usage metrics show cumulative count of Article Views (full-text article views including HTML views, PDF and ePub downloads, according to the available data) and Abstracts Views on Vision4Press platform.
Data correspond to usage on the plateform after 2015. The current usage metrics is available 48-96 hours after online publication and is updated daily on week days.
Initial download of the metrics may take a while.