Fig. 14
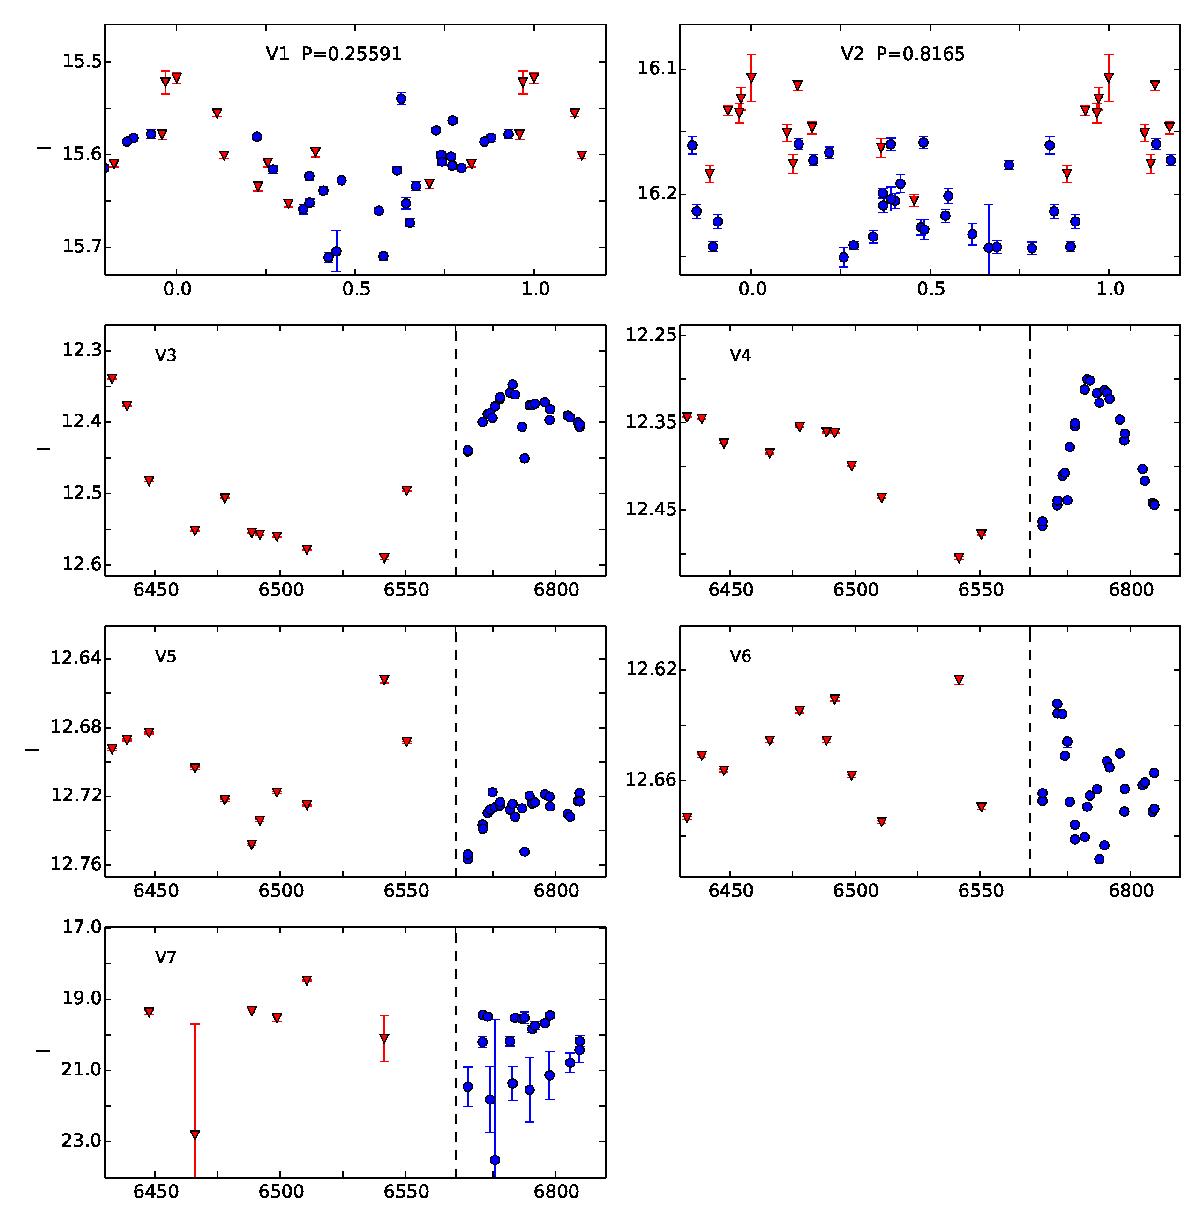
NGC 6528: light curves for the variables in our FoV. Red triangles are 2013 data and blue circles are 2014 data. Error bars are plotted but are smaller than the data symbols in many cases. Light curves with confirmed periods are phased. For those variables without periods the x-axis refers to (HJD – 2 450 000), and the dashed line indicates that the period from HJD 2 456 570 to 2 456 760 has been removed from the plot, as no observations were performed during this time range.
Current usage metrics show cumulative count of Article Views (full-text article views including HTML views, PDF and ePub downloads, according to the available data) and Abstracts Views on Vision4Press platform.
Data correspond to usage on the plateform after 2015. The current usage metrics is available 48-96 hours after online publication and is updated daily on week days.
Initial download of the metrics may take a while.