Fig. 7
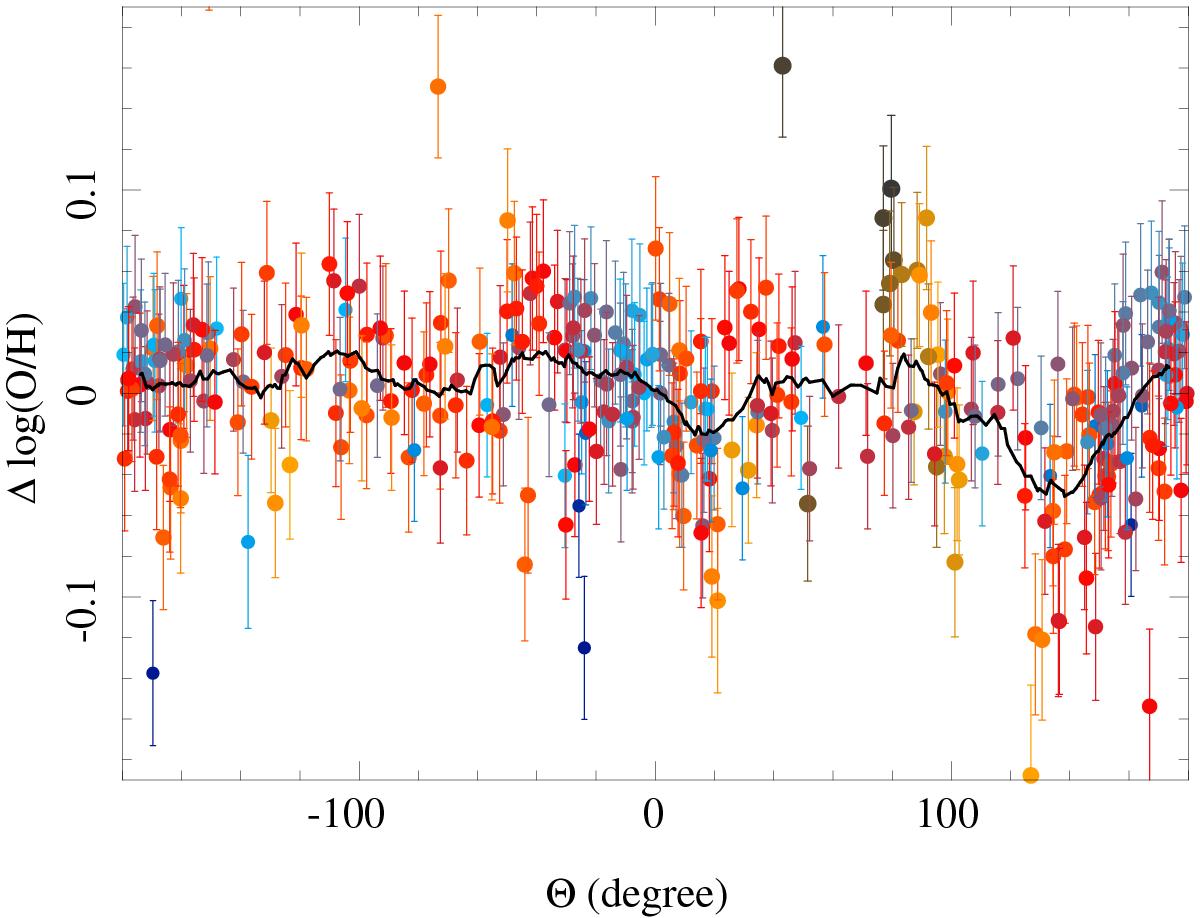
Azimuthal distribution of the residual of the oxygen abundance for the individual H ii regions after subtracting the average radial gradient. The colors and sizes indicate the galactocentric distance, with blue solid circles corresponding to H ii regions nearer to the center of the galaxy, and red or orange ones corresponding to those farther away. The solid line corresponds to the average value at each azimuthal angle for H ii regions within 25° of the considered angle.
Current usage metrics show cumulative count of Article Views (full-text article views including HTML views, PDF and ePub downloads, according to the available data) and Abstracts Views on Vision4Press platform.
Data correspond to usage on the plateform after 2015. The current usage metrics is available 48-96 hours after online publication and is updated daily on week days.
Initial download of the metrics may take a while.