Fig. 6
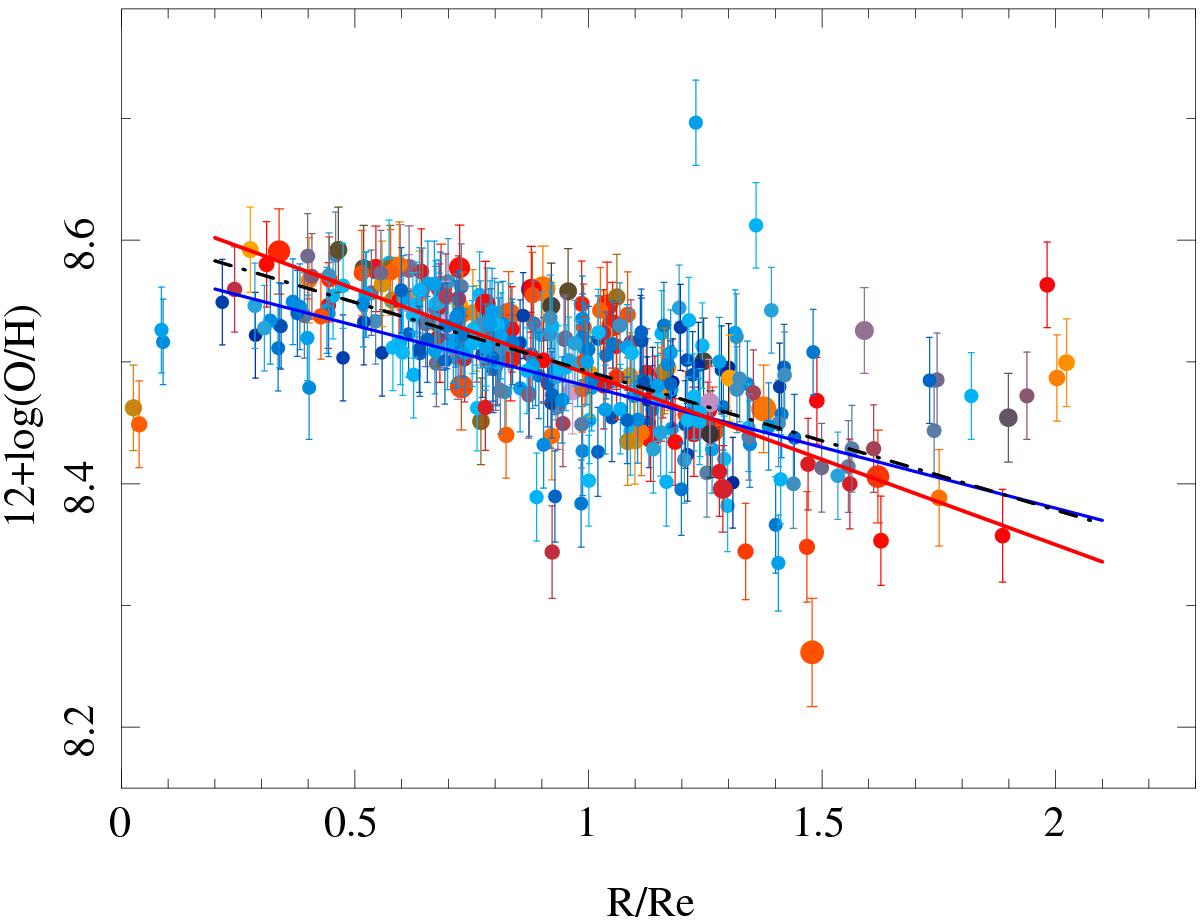
Radial distribution for the oxygen abundance derived using the O3N2 indicator for the 396 H ii regions detected in NGC 6754, color-coded by the equivalent width of Hα. The small blue symbols correspond to H ii regions with an emission EW(Hα) lower than 20 Å, while the larger red and grey symbols correspond to regions with higher values. The error bars illustrate the individual errors of the abundance propagated from the estimated errors of the emission lines, not including the systematic error of the abundance calibrator. The dash-dotted black line shows the result of the best linear regression to all the points. The blue and red solid lines correspond to the results of the best linear regressions to the H ii regions of lower and higher values of EW(Hα).
Current usage metrics show cumulative count of Article Views (full-text article views including HTML views, PDF and ePub downloads, according to the available data) and Abstracts Views on Vision4Press platform.
Data correspond to usage on the plateform after 2015. The current usage metrics is available 48-96 hours after online publication and is updated daily on week days.
Initial download of the metrics may take a while.