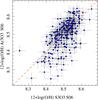
Fig. 5
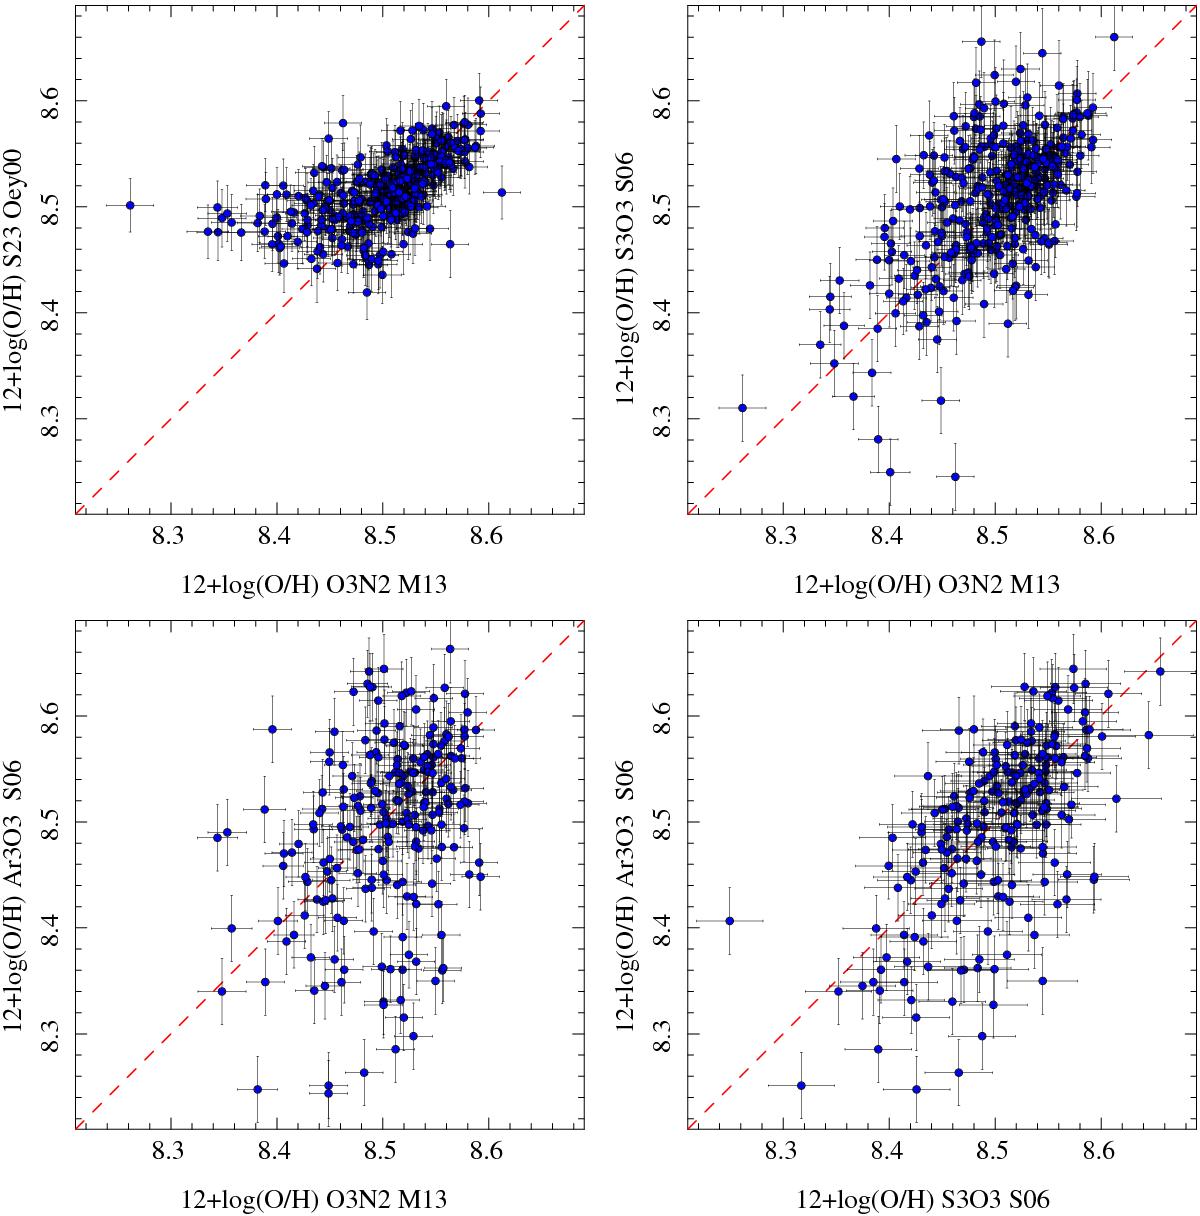
Comparison of the oxygen abundances derived using the different indicators described in the text: (i) S23 vs. O3N2 (top left panel); (ii) S3O3 vs. O3N2 (top right panel); (iii) ArO3 vs. O3N2 (bottom left panel); and (iv) ArO3 vs. S3O3 (bottom right panel). Each blue solid circle corresponds to an individual H ii region in the sample. The error bars represent half of the estimated error considering the propagation of the emission line errors and the uncertainty in the calibrator. The dashed line in each panel corresponds to the one-to-one relation.
Current usage metrics show cumulative count of Article Views (full-text article views including HTML views, PDF and ePub downloads, according to the available data) and Abstracts Views on Vision4Press platform.
Data correspond to usage on the plateform after 2015. The current usage metrics is available 48-96 hours after online publication and is updated daily on week days.
Initial download of the metrics may take a while.