Fig. 4
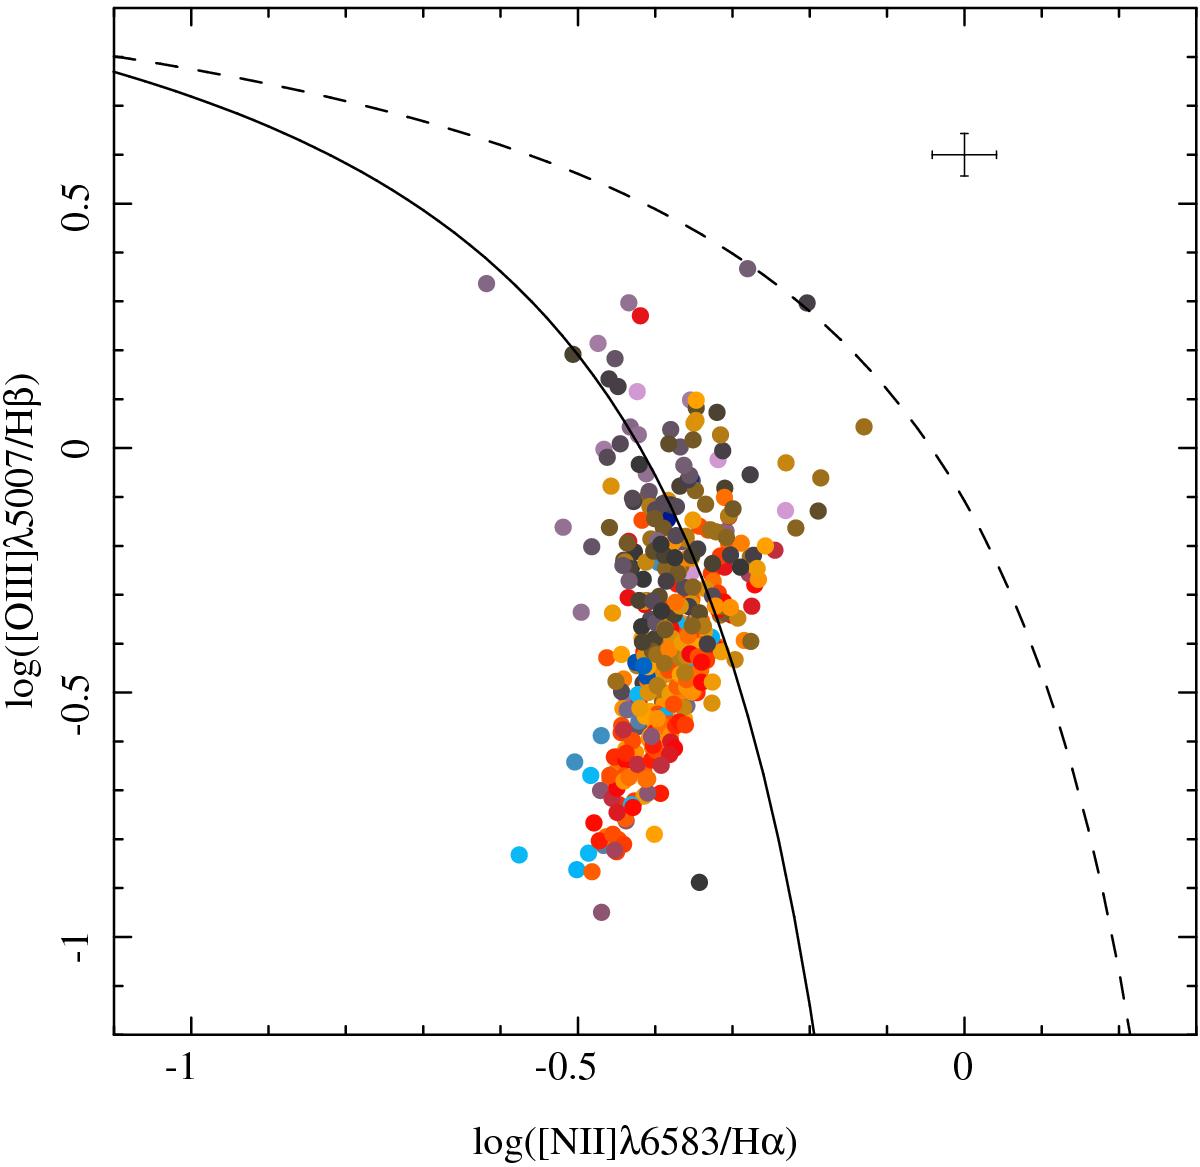
[O iii] λ5007/Hβ vs. [N ii] λ6583/Hα diagnostic diagram for the 396 H ii ionized regions detected in NGC 6754, color-coded by the deprojected galactocentric distance (where bluer colors correspond to the central regions, and reddish-to-grey colors correspond to the outer regions). Solid and dashed lines represent, respectively, the Kauffmann et al. (2003) and Kewley et al. (2001) demarcation curves. They are usually invoked to distinguish between classical star-forming objects (below thesolid line), and AGN powered sources (above the dashed line). Regions between both lines are considered intermediate ones. The average error of the line ratios is represented by the error bar in the upper-right corner.
Current usage metrics show cumulative count of Article Views (full-text article views including HTML views, PDF and ePub downloads, according to the available data) and Abstracts Views on Vision4Press platform.
Data correspond to usage on the plateform after 2015. The current usage metrics is available 48-96 hours after online publication and is updated daily on week days.
Initial download of the metrics may take a while.