Free Access
Fig. 2
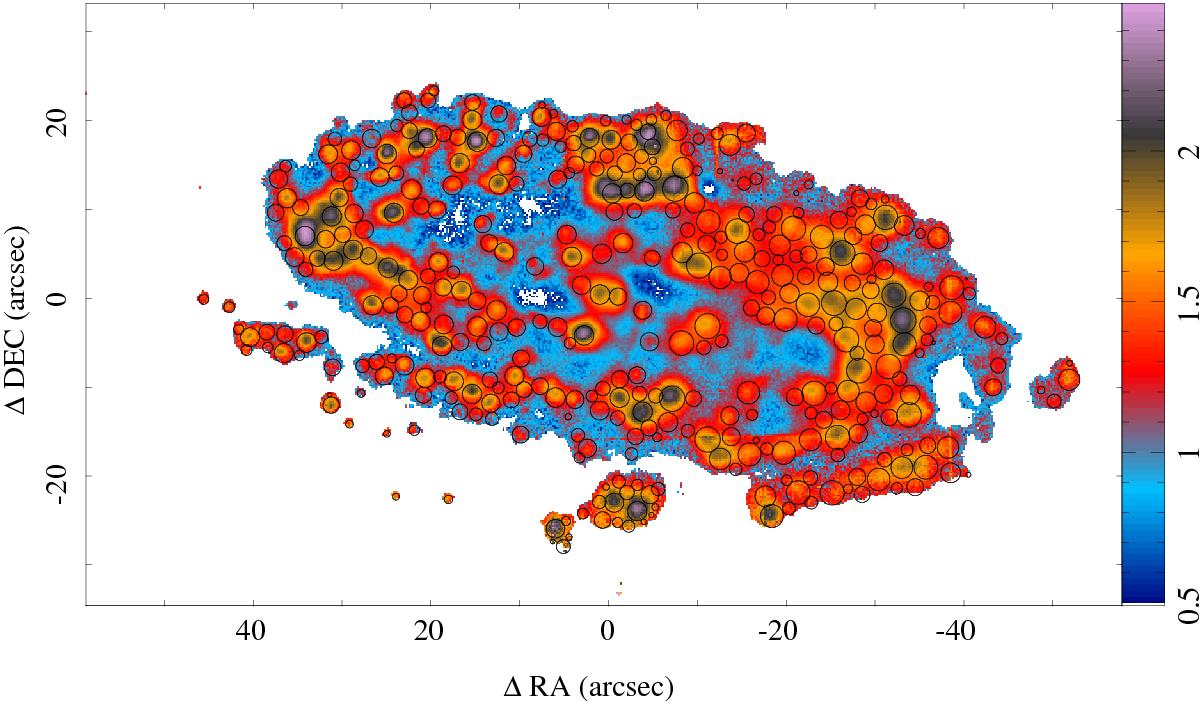
Color-coded map of the equivalent width of Hα in logarithmic scale. The areas with Hα density flux below 1.5 × 10⁻¹⁸ erg s-1 cm-2 spaxel-1 (~3σ detection limit) have been masked. The circles represent the detected H ii regions; the radius is proportional to the extraction aperture.
Current usage metrics show cumulative count of Article Views (full-text article views including HTML views, PDF and ePub downloads, according to the available data) and Abstracts Views on Vision4Press platform.
Data correspond to usage on the plateform after 2015. The current usage metrics is available 48-96 hours after online publication and is updated daily on week days.
Initial download of the metrics may take a while.