Fig. 9
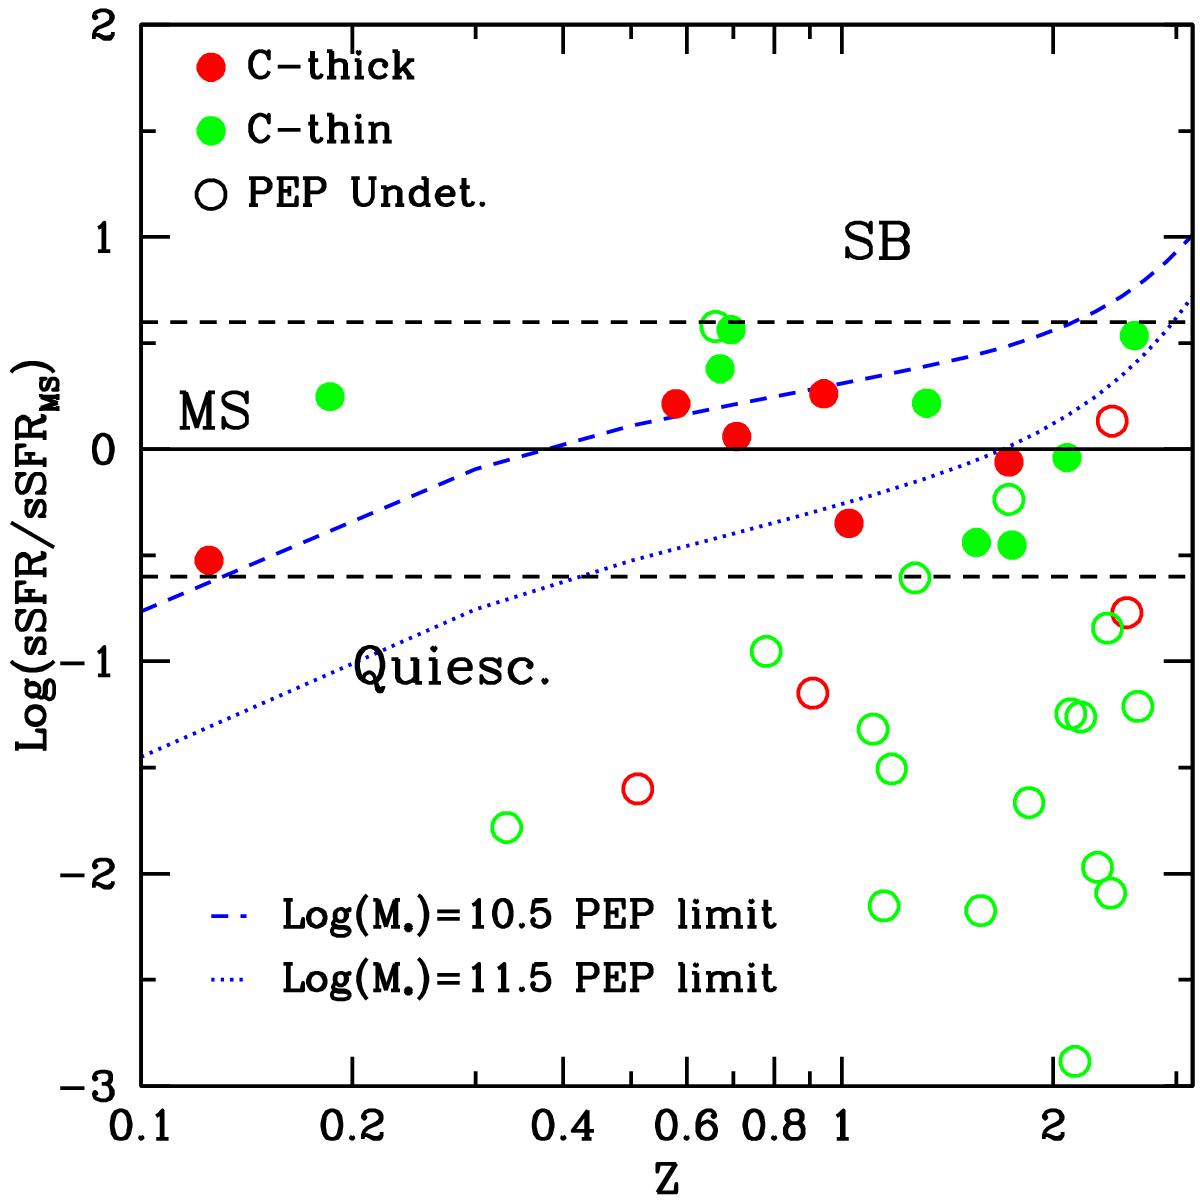
Ratio between the sSFR of highly obscured sources and the sSFR of MS star forming galaxies, as a function of redshift. Red (green) circles represent CTKf (CTNf) sources. Filled (empty) circles represent Herschel PACS detected (undetected) sources. The MS is taken from Whitaker et al. (2012). The dashed lines shows the ratio sSFR/sSFRMS = 4 times above and below the MS, used as starbursts and quiescent galaxy definition. The blue dotted (dashed) curves mark the sSFR/sSFRMS observability limit of the Herschel PEP survey in COSMOS, obtained for a Log (M∗) = 11.5 (10.5), using the Seyfert-2 template of Polletta et al. (2007).
Current usage metrics show cumulative count of Article Views (full-text article views including HTML views, PDF and ePub downloads, according to the available data) and Abstracts Views on Vision4Press platform.
Data correspond to usage on the plateform after 2015. The current usage metrics is available 48-96 hours after online publication and is updated daily on week days.
Initial download of the metrics may take a while.