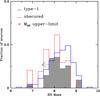
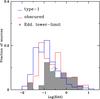
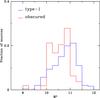
Fig. 8
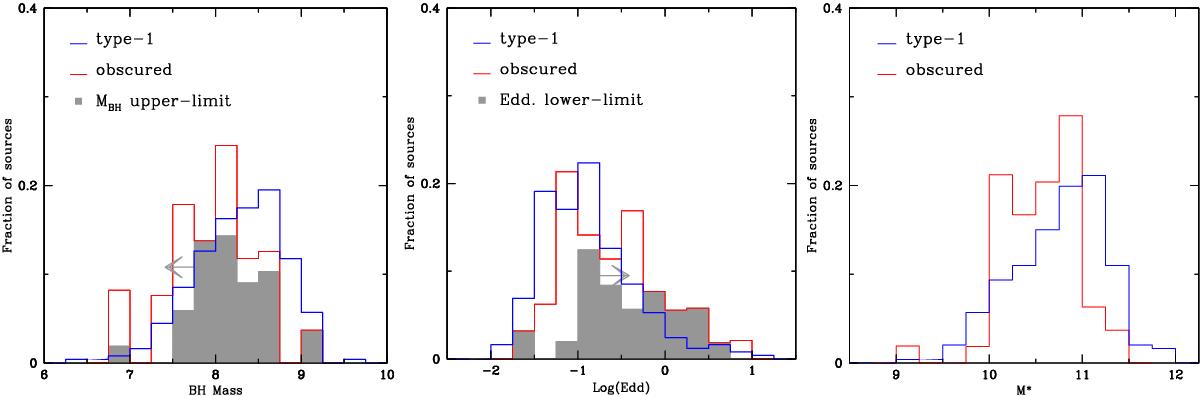
Left panel: fractional distribution of Log (MBH) for type-1 sources (in blue) and highly obscured sources (red). The gray shaded histogram and arrow show obscured sources for which the MBH must be considered an upper limit, due to lack of bulge-to-total mass ratio information. Central panel: fractional distribution of Log (λEdd) (same colors of left panel). The gray shaded histogram and arrow show obscured sources for which the λEdd must be considered a lower limit, due to the upper limit in MBH. Right panel: fractional distribution of the total stellar mass, as computed through SED fitting either in L12, B12 or D14 (same colors of left panel).
Current usage metrics show cumulative count of Article Views (full-text article views including HTML views, PDF and ePub downloads, according to the available data) and Abstracts Views on Vision4Press platform.
Data correspond to usage on the plateform after 2015. The current usage metrics is available 48-96 hours after online publication and is updated daily on week days.
Initial download of the metrics may take a while.