Fig. 7
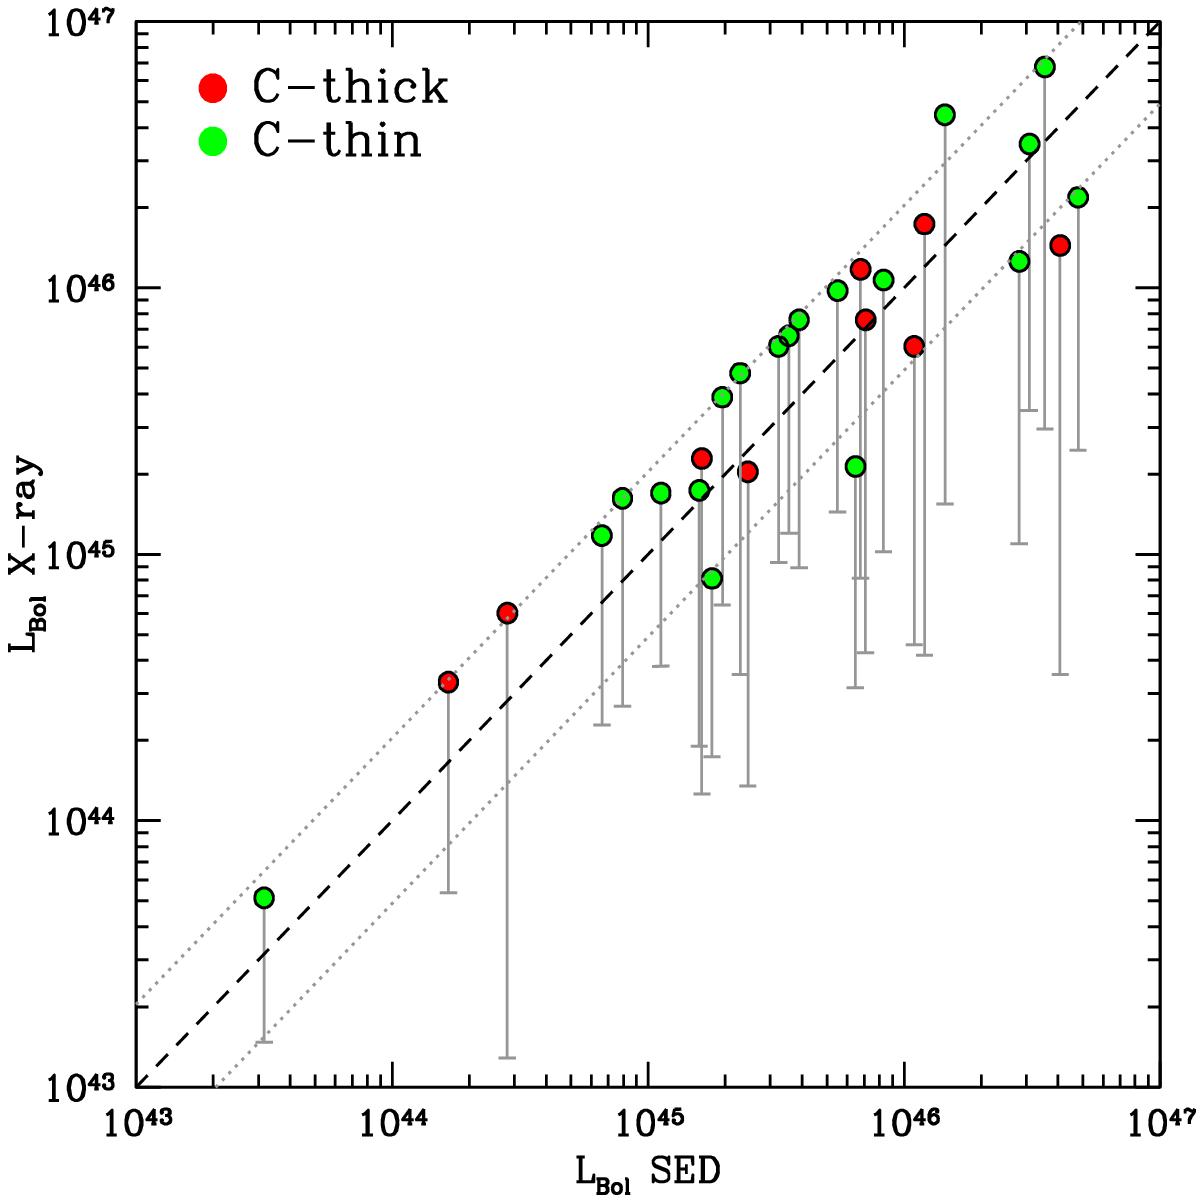
Comparison between the SED-based Lbol from L12 or D14 and the X-raybased Lbol for CTKf (CTNf) sources in red (green). The error-bars show the difference between the Lbol computed from the absorption-corrected and the observed L2 − 10. The dashed line shows the 1:1 relation, while the dotted lines show the 1σ dispersion of 0.31 dex.
Current usage metrics show cumulative count of Article Views (full-text article views including HTML views, PDF and ePub downloads, according to the available data) and Abstracts Views on Vision4Press platform.
Data correspond to usage on the plateform after 2015. The current usage metrics is available 48-96 hours after online publication and is updated daily on week days.
Initial download of the metrics may take a while.