Fig. 6
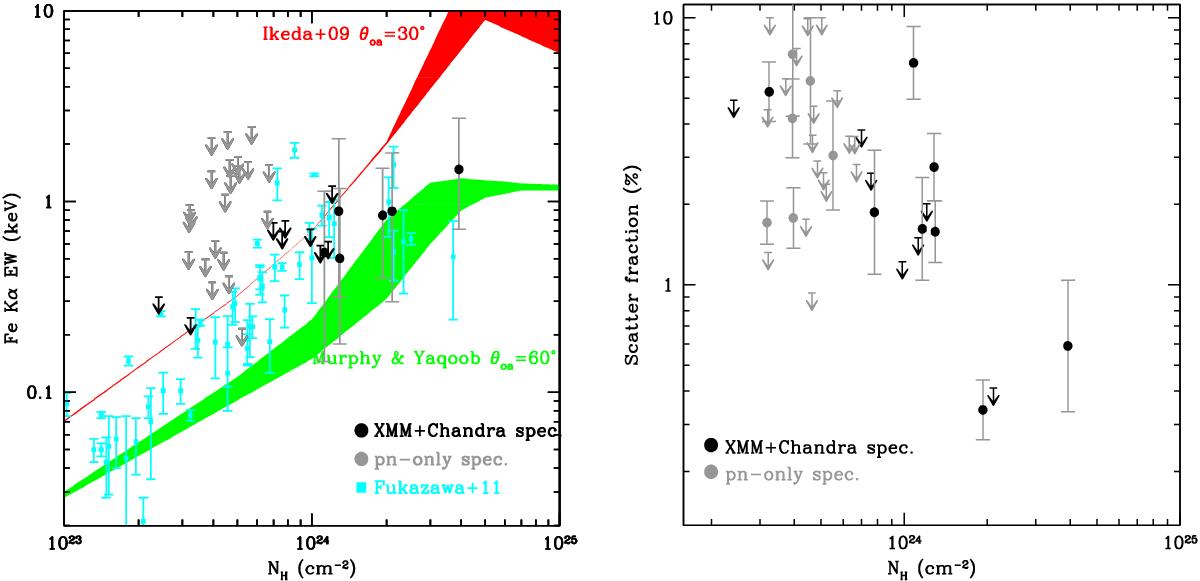
Left panel: column density vs. Fe Kα EW for the obscured sources with pn+MOS+Chandra joint fit (black) and pn only fit (gray). The red (green) shaded areas show the expected Fe Kα EW as a function of NH as computed in the torus model of Ikeda et al. 2009 (Murphy & Yaqoob 2009). Cyan points represent the observed NH and EW for a sample of local Seyfert galaxies observed with Suzaku (Fukazawa et al. 2011). Right panel: scattered fraction vs. column density for the obscured sources with pn+MOS+Chandra joint fit (black) and pn only fit (gray).
Current usage metrics show cumulative count of Article Views (full-text article views including HTML views, PDF and ePub downloads, according to the available data) and Abstracts Views on Vision4Press platform.
Data correspond to usage on the plateform after 2015. The current usage metrics is available 48-96 hours after online publication and is updated daily on week days.
Initial download of the metrics may take a while.