Fig. D.1
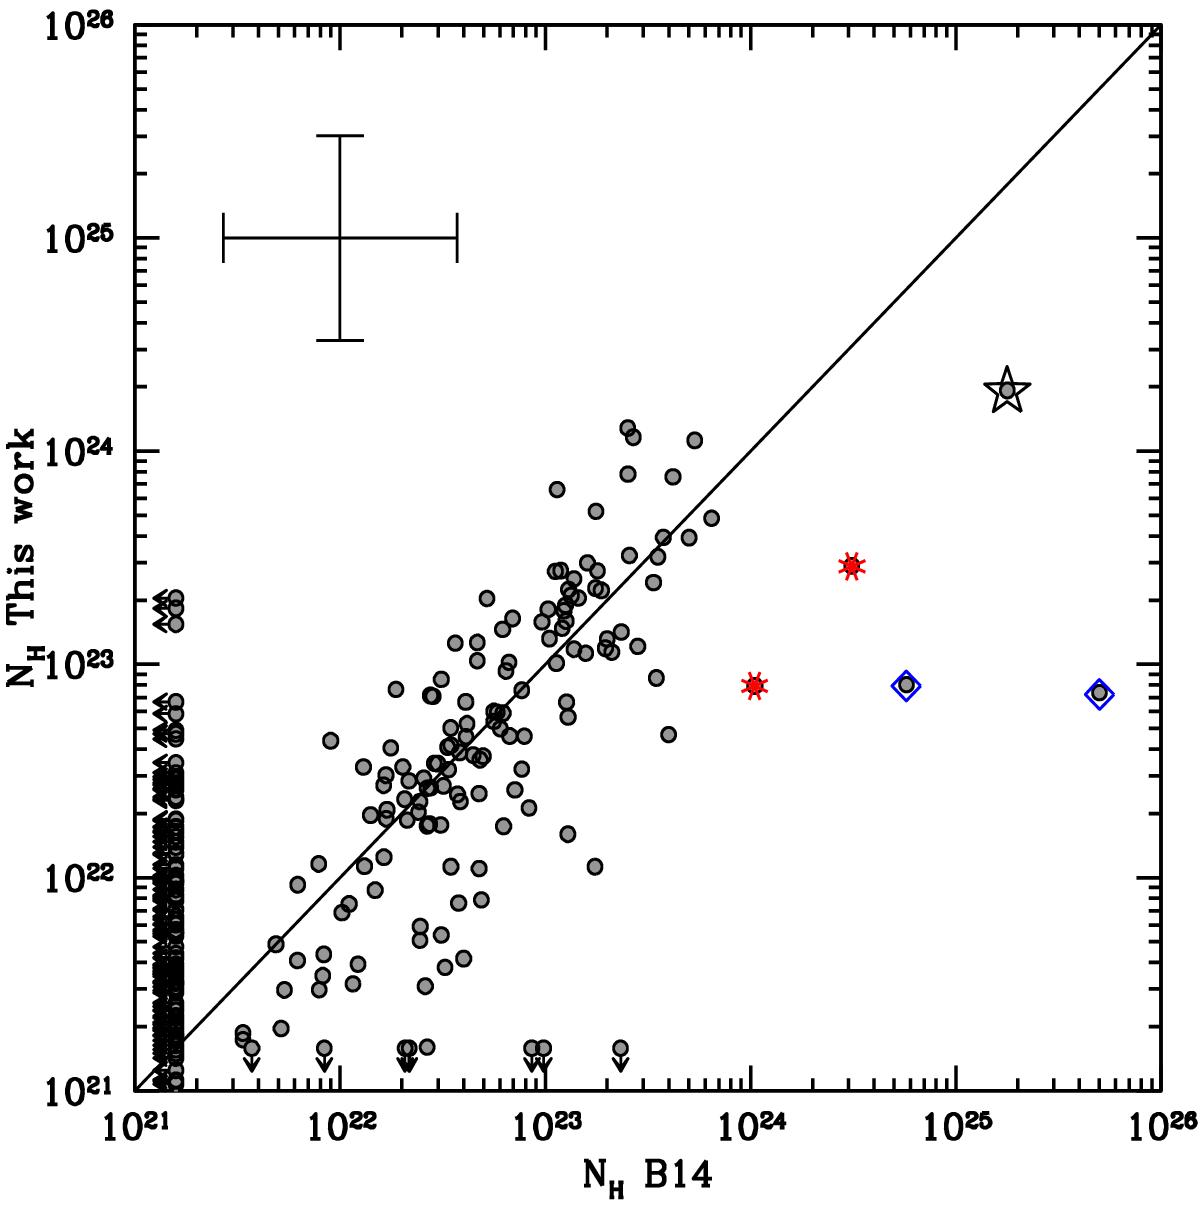
Comparison between of the best fit NH from B14 and this work, for the 433 sources in common. The star show the location of source XID 2608. With cyan diamonds are marked two sources for which the nature of CT sources from Chandra data is not confirmed with better XMM-Newton spectra. In red are shown two sources for which the fit of the XMM-Newton spectrum shows a secondary minimum at CT values. The average error-bar is shown in the top left corner.
Current usage metrics show cumulative count of Article Views (full-text article views including HTML views, PDF and ePub downloads, according to the available data) and Abstracts Views on Vision4Press platform.
Data correspond to usage on the plateform after 2015. The current usage metrics is available 48-96 hours after online publication and is updated daily on week days.
Initial download of the metrics may take a while.