Fig. C.1
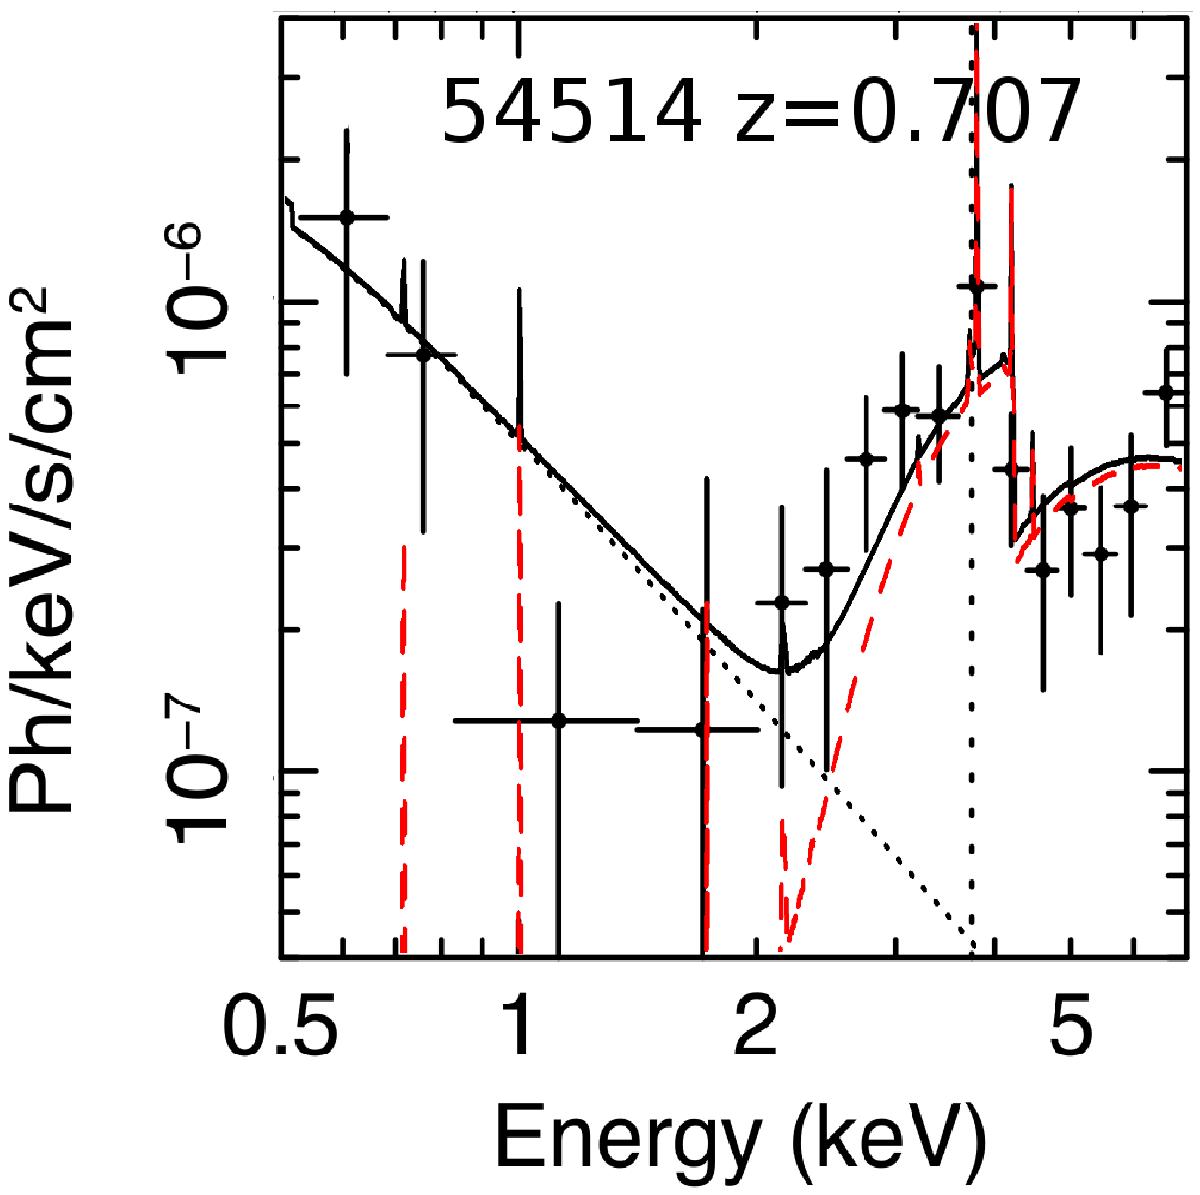
Unfolded, merged pn+MOS+Chandra spectrum of one of the sources in the CTKf sample, shown as an example. The best fit model is shown with the black solid curve. The TORUS component is shown with the red dashed curve, while the scattered component is shown with the black dotted curve. The XMM source ID and redshift are labeled. The dashed line marks the expected location of the 6.4 keV Fe Kα line.
Current usage metrics show cumulative count of Article Views (full-text article views including HTML views, PDF and ePub downloads, according to the available data) and Abstracts Views on Vision4Press platform.
Data correspond to usage on the plateform after 2015. The current usage metrics is available 48-96 hours after online publication and is updated daily on week days.
Initial download of the metrics may take a while.