Fig. B.1
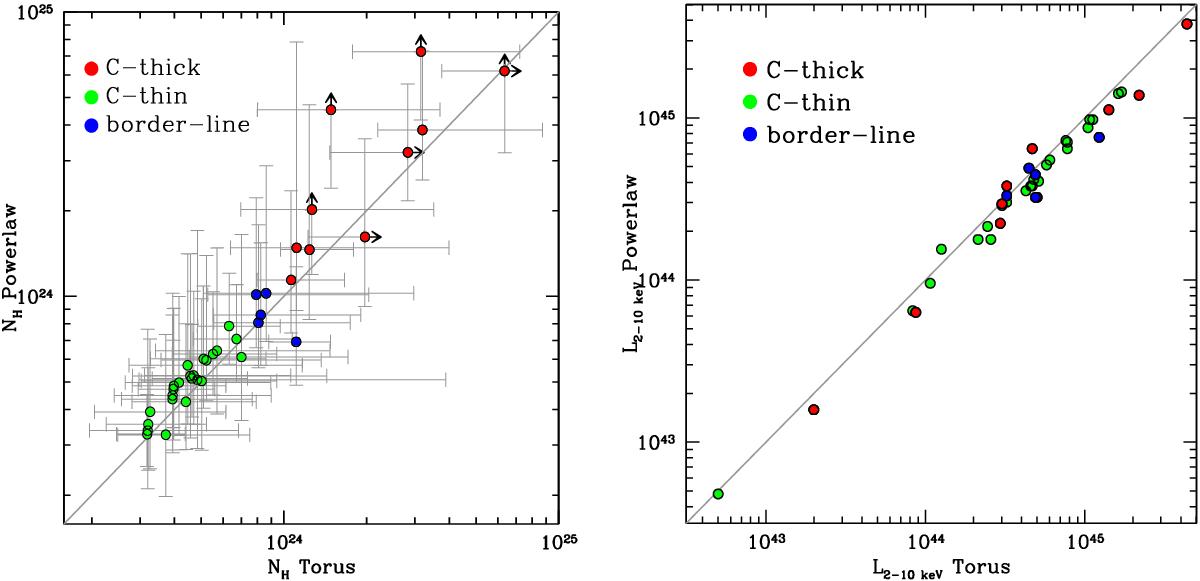
Left panel: comparison of the NH best fit obtained from the Pl (y-axis) and Tor (x-axis) models. Right panel: comparison of the 2−10 keV, absorption corrected luminosity, obtained from the same two models. In both panels we show CTNi sources in green, CTKi sources in red and border-line sources in blue, and the solid line represents the 1:1 relation.
Current usage metrics show cumulative count of Article Views (full-text article views including HTML views, PDF and ePub downloads, according to the available data) and Abstracts Views on Vision4Press platform.
Data correspond to usage on the plateform after 2015. The current usage metrics is available 48-96 hours after online publication and is updated daily on week days.
Initial download of the metrics may take a while.