Fig. A.1
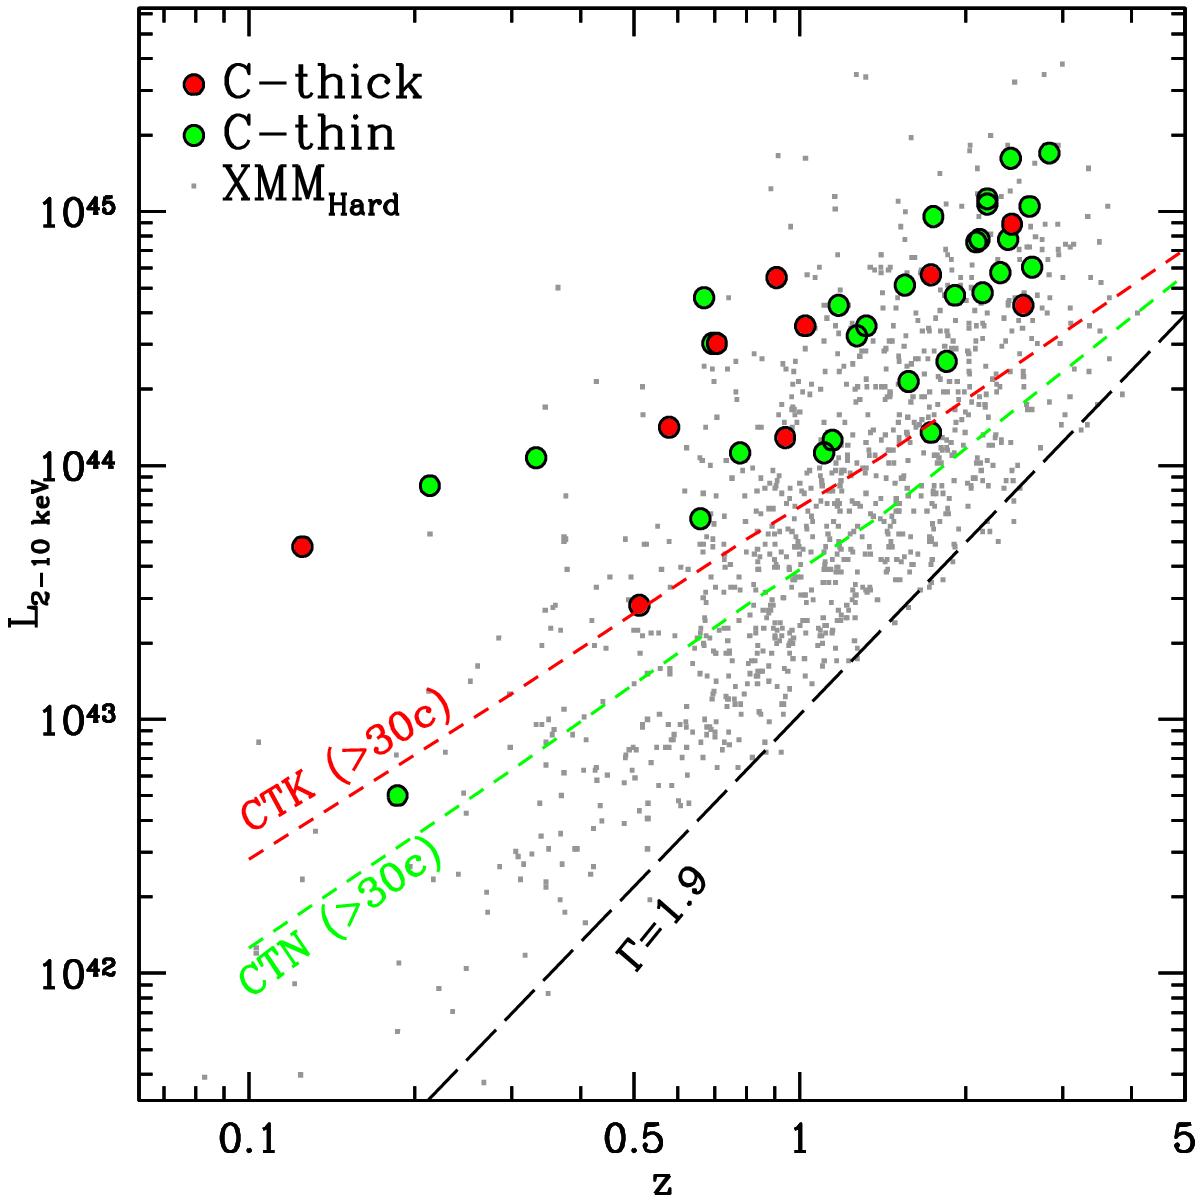
Redshift vs. L2 − 10 distribution for CTKf (red) and CTNf (green) sources. Gray squares represent the 2−10 keV band detected XMM-COSMOS sources. The black dashed line represents the detection limit computed for an unabsorbed power-law with Γ = 1.9, while the red (green) dashed line show the detection limit computed for a CTK (CTN) source.
Current usage metrics show cumulative count of Article Views (full-text article views including HTML views, PDF and ePub downloads, according to the available data) and Abstracts Views on Vision4Press platform.
Data correspond to usage on the plateform after 2015. The current usage metrics is available 48-96 hours after online publication and is updated daily on week days.
Initial download of the metrics may take a while.