Fig. 3
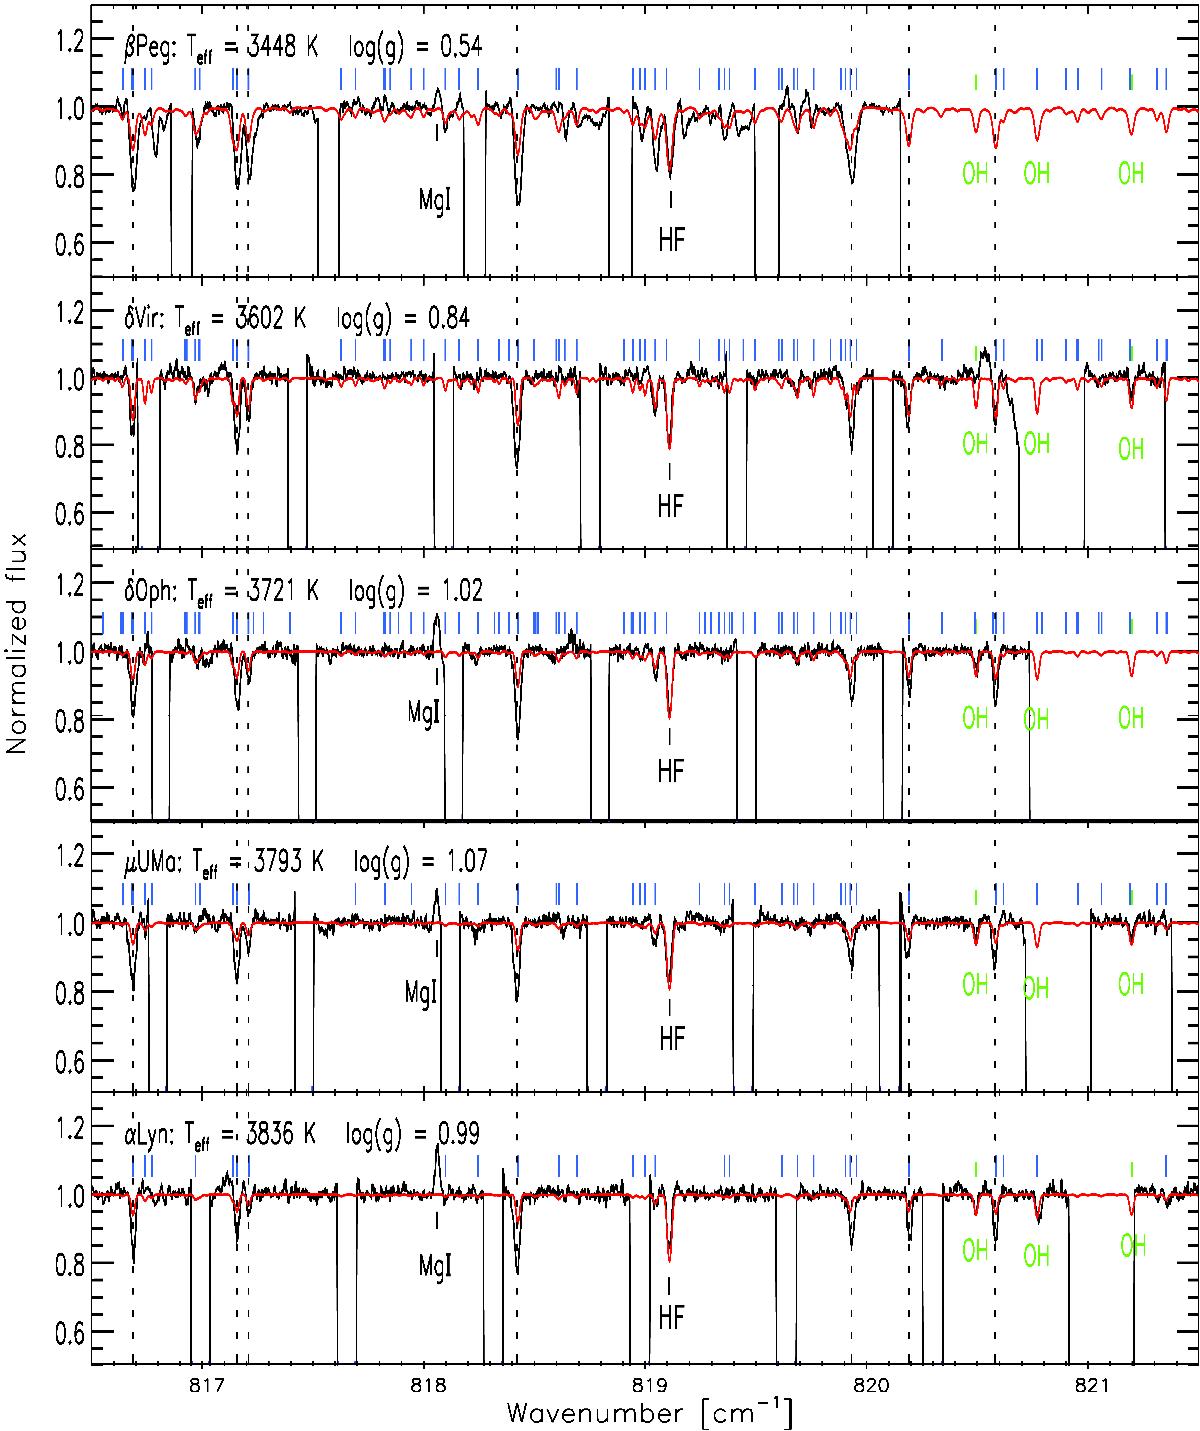
Observations of the five coolest stars. The observed spectra are shown with black lines and the synthetic spectra with red lines. The blue ticks above the spectra indicate spectral features of H2O whereas green marks OH(ν = 3 − 3) lines. Dashed lines mark the spectral features of interest which are ultimately used in the calculation of the formation region temperatures. In addition, one emission feature in the form of neutral Mg is visible at 818.1 cm-1, and the HF line is also marked. The lack of observational data between the orders of the spectrometer, is indicated by the vertical solid black lines.
Current usage metrics show cumulative count of Article Views (full-text article views including HTML views, PDF and ePub downloads, according to the available data) and Abstracts Views on Vision4Press platform.
Data correspond to usage on the plateform after 2015. The current usage metrics is available 48-96 hours after online publication and is updated daily on week days.
Initial download of the metrics may take a while.