Fig. 5
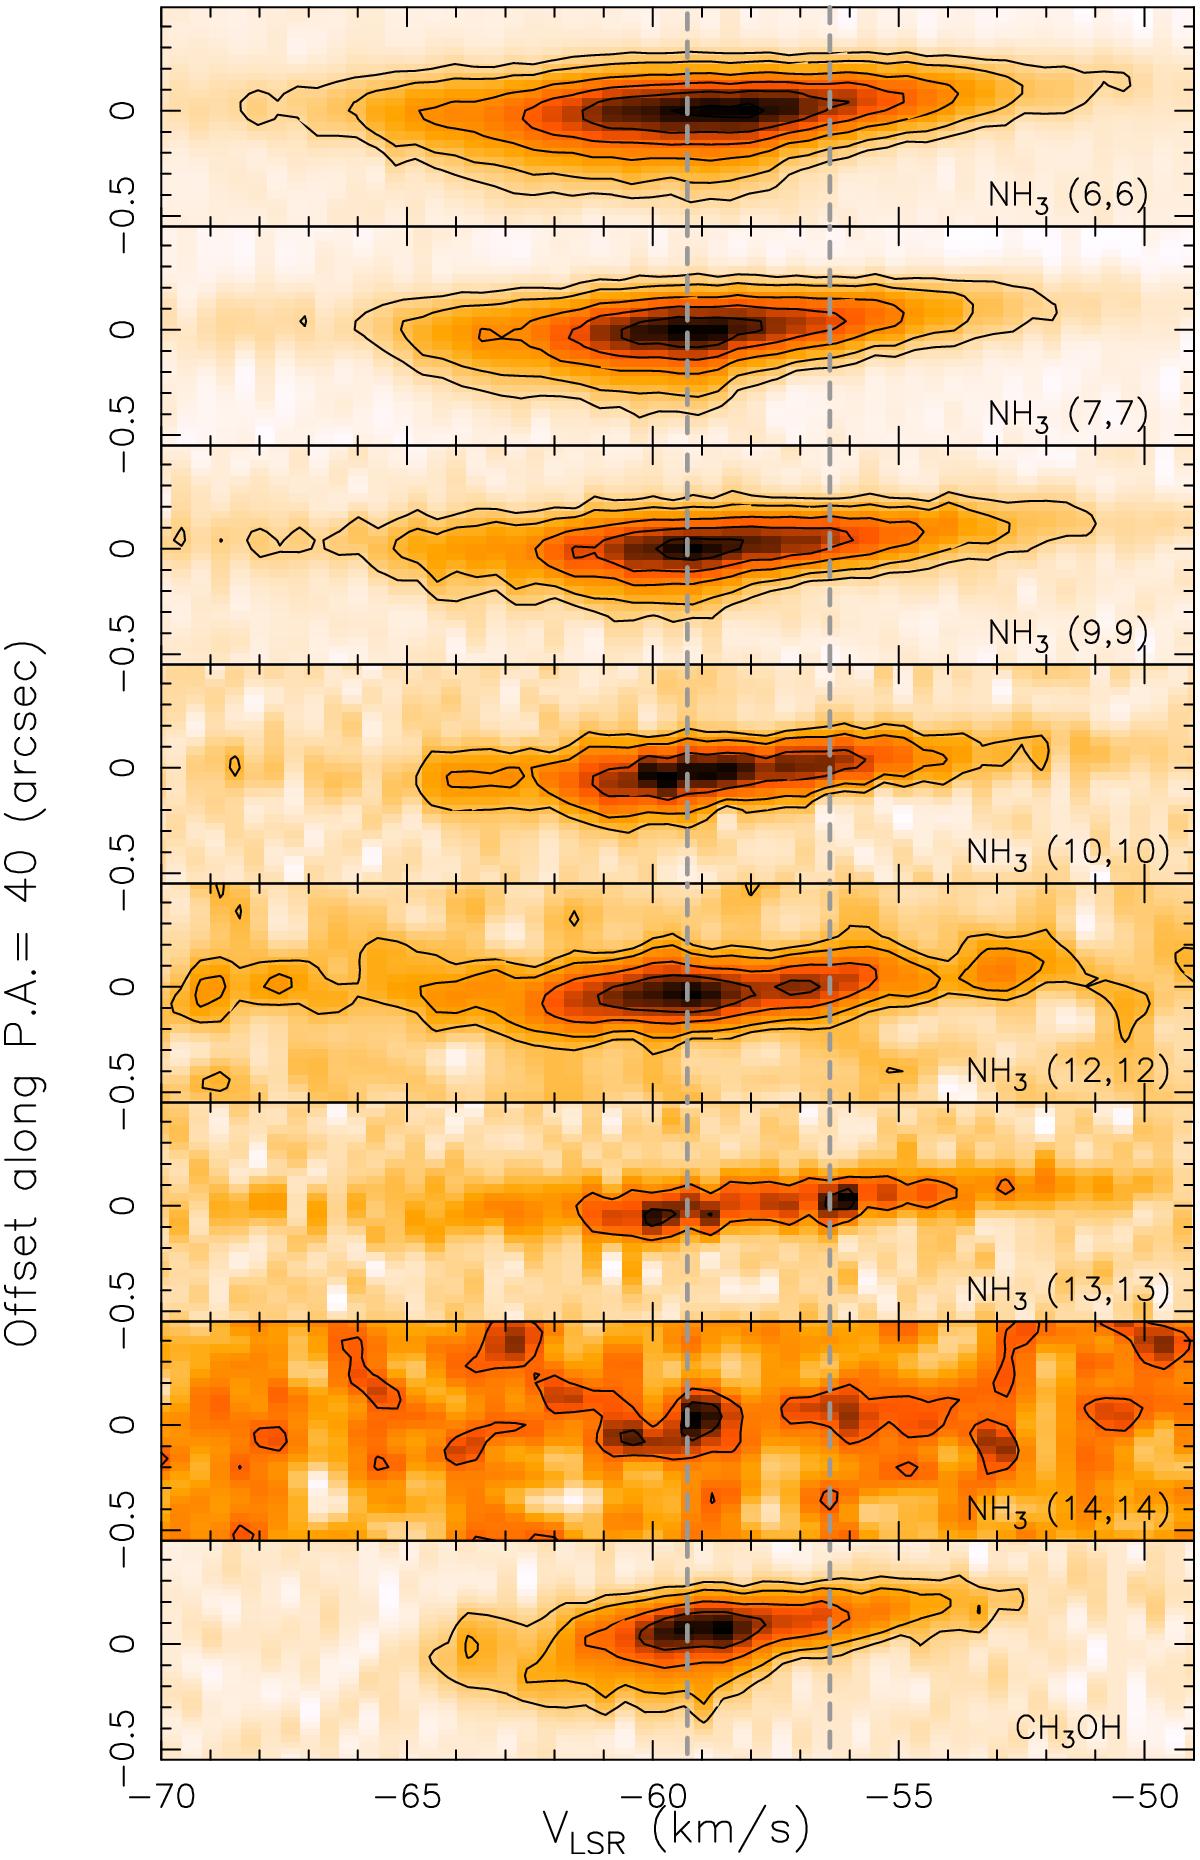
Position-velocity diagrams of the (J,K) = (6, 6), (7, 7). (9, 9), (10, 10), (12, 12), (13, 13), (14, 14) lines as well as the CH3OH line observed with the JVLA B-array towards NGC 7538 IRS1. The cut is taken at the peak of the NH3 core with a PA = 40° for the NH3 (6, 6), (7, 7). (9, 9), and CH3OH lines, and PA = 35° for the NH3 (10, 10), (12, 12), (13, 13), and (14, 14) lines. The contours are drawn at steps of −0.008 Jy beam-1 starting from −0.004 Jy beam-1. The images were constructed with a 0.′′04 pixel for all transitions. Only the main hyperfine line is shown for each transition. The vertical dashed lines indicate the velocities of −59.3 and 56.4 km s-1. The PA is measured from north to east.
Current usage metrics show cumulative count of Article Views (full-text article views including HTML views, PDF and ePub downloads, according to the available data) and Abstracts Views on Vision4Press platform.
Data correspond to usage on the plateform after 2015. The current usage metrics is available 48-96 hours after online publication and is updated daily on week days.
Initial download of the metrics may take a while.