Fig. 4
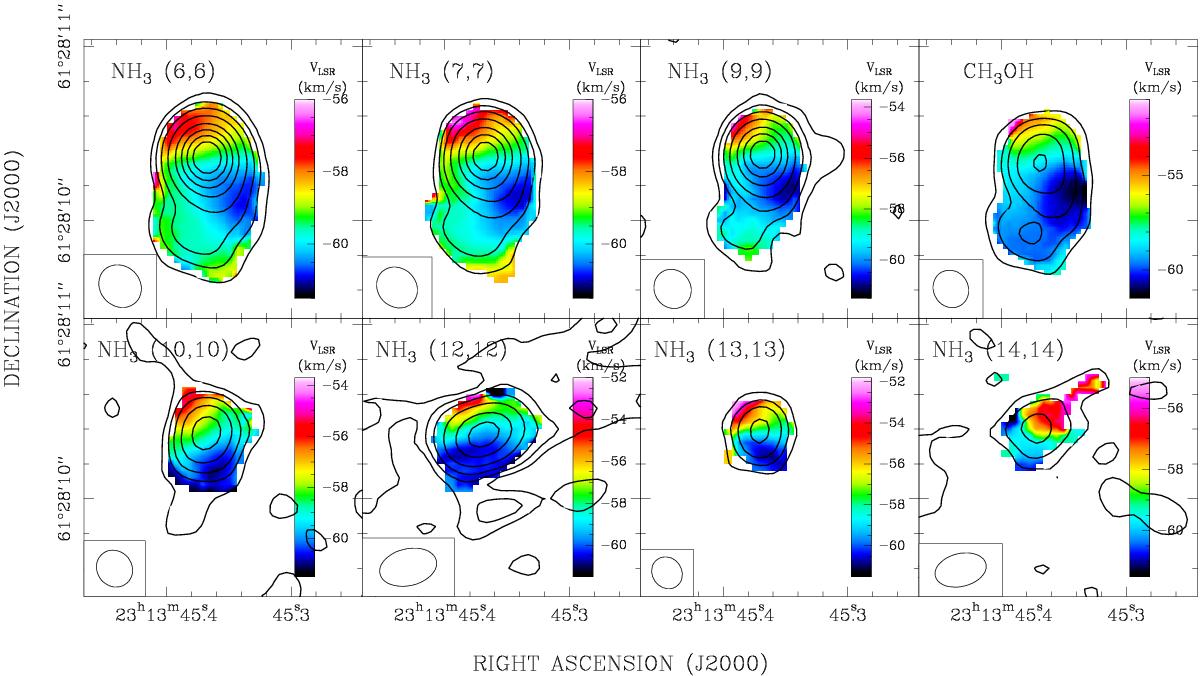
Velocity fields of seven inversion transitions of NH3 as well as the CH3OH line, as measured toward NGC 7538 IRS1 with the JVLA B-array. The 1st moment maps (images) are overlaid on the total intensity 0th moment maps (contours). Colors indicate VLSR in km s-1. The images were constructed with a 0.′′04 pixel for all transitions. The contours represent factors 1, 3, 6, 12,... (afterwards, they are spaced by 10) of −20 mJy beam-1, for all transitions. A flux cutoff of −7 to −11 mJy beam-1 (~ 3 − 4σ) was used for various transitions, except the (12, 12) and (14, 14) transitions, for which the cutoff was set to 20 mJy beam-1. We note that different velocity scales are used in different panels; in particular, color scales are expanded towards higher velocities with increasing quantum number to clearly show the redshifted absorption, e.g., NH3 (13, 13). All transitions show a velocity gradient NE-SW from NGC 7538 IRS1, at approximately 30−40° (depending on transition), with the exception of the (14, 14) line. The synthesized beams (0.′′17−0.′′33) are shown in the lower left corner of each panel (see Table 1).
Current usage metrics show cumulative count of Article Views (full-text article views including HTML views, PDF and ePub downloads, according to the available data) and Abstracts Views on Vision4Press platform.
Data correspond to usage on the plateform after 2015. The current usage metrics is available 48-96 hours after online publication and is updated daily on week days.
Initial download of the metrics may take a while.