Fig. 9
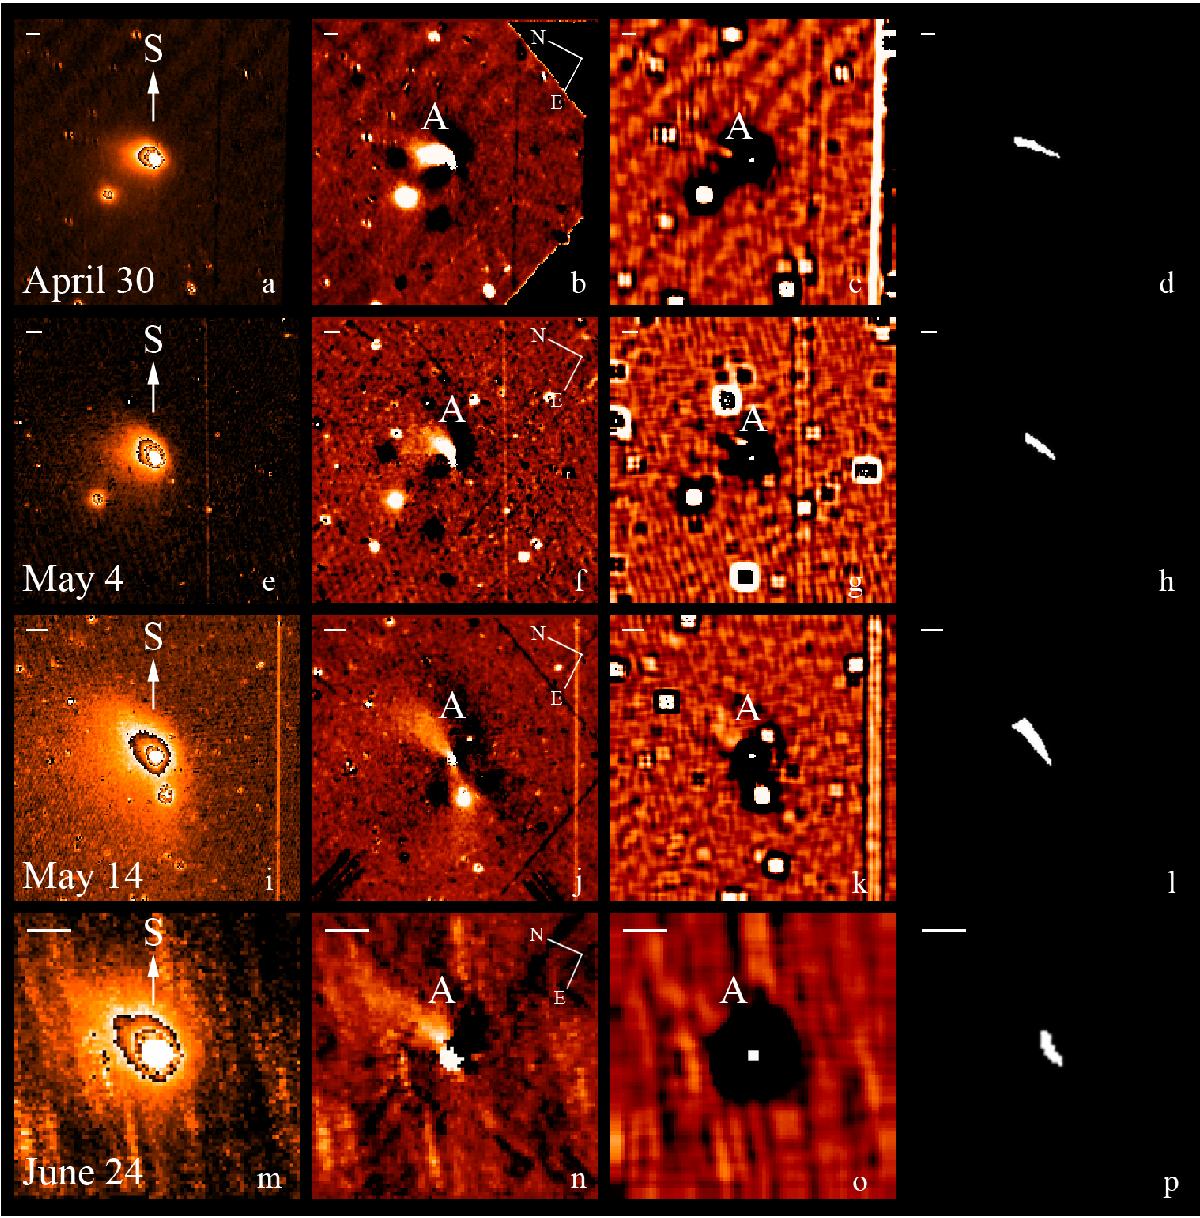
Coma structures found in NAC orange (April 30, May 4, and May 14) and WAC visible-610 (June 24) data with image-enhancing techniques. First, second, and third column shows an isophotal representation of the corresponding original image, Larson-Sekanina, and adaptive Laplace filtering results, respectively. The last column shows dynamical simulations of the coma structures for the same observing dates. Each white pixel indicates the presence of dust particles, without photometric information. Arrows pointing S give the direction of the Sun in the frames. The north-east orientation is given in images in the second column. The horizontal bar in the upper left corners corresponds to a scale length of 400 km for NAC images and 150 km for WAC images. The size of each image is 180 × 180 pix for NAC and 80 × 80 pix for WAC.
Current usage metrics show cumulative count of Article Views (full-text article views including HTML views, PDF and ePub downloads, according to the available data) and Abstracts Views on Vision4Press platform.
Data correspond to usage on the plateform after 2015. The current usage metrics is available 48-96 hours after online publication and is updated daily on week days.
Initial download of the metrics may take a while.