Free Access
Fig. 4
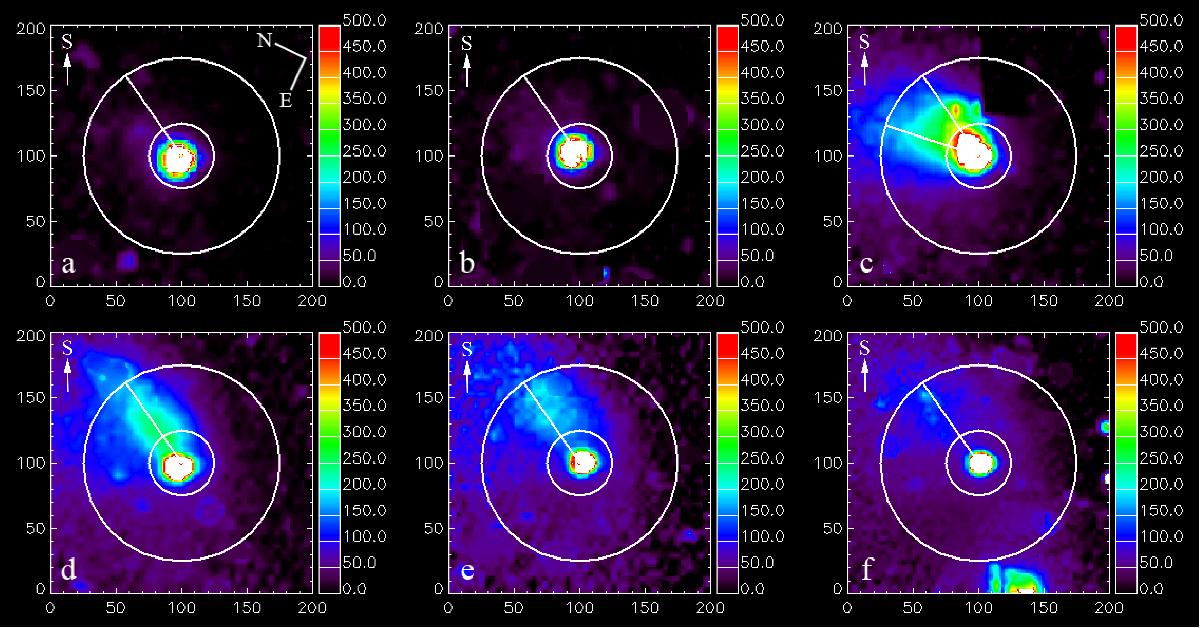
Intensity maps for April 24 a); April 27 b); April 30 c); May 5 d); May 7 e); and May 11 f). Each image corresponds to an area of 1600 × 1600 km and the comet is place in the centre. The orientation of the images is shown in the first panel.
Current usage metrics show cumulative count of Article Views (full-text article views including HTML views, PDF and ePub downloads, according to the available data) and Abstracts Views on Vision4Press platform.
Data correspond to usage on the plateform after 2015. The current usage metrics is available 48-96 hours after online publication and is updated daily on week days.
Initial download of the metrics may take a while.