Fig. 5
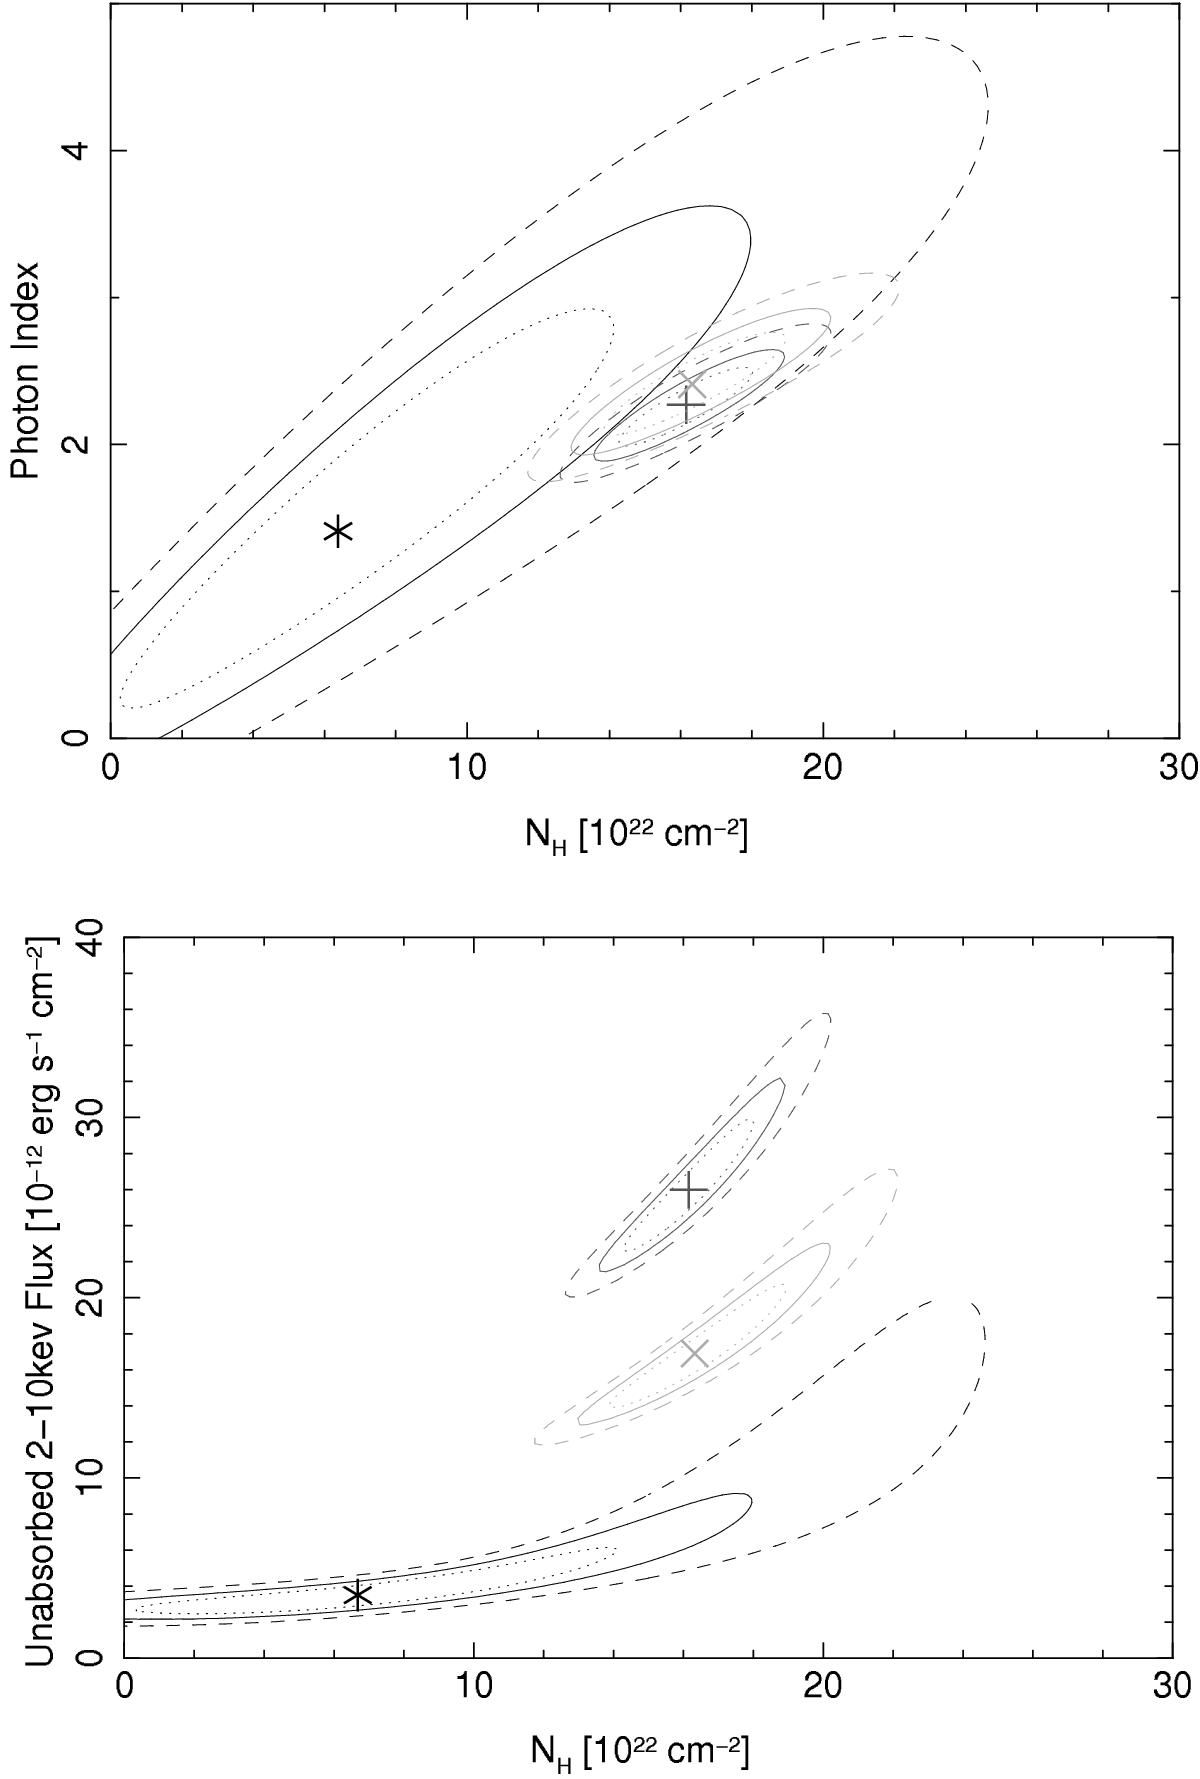
Confidence contours for Sgr A* spectral parameters. Contours are the confidence levels of 68% (dotted line), 90% (solid line), and 99% (dashed line) for the two parameters in the graph. The three sets of confidence contours represent the 2011 March 30 flare (black lines and asterisk), the 2007 April 4 flare (light gray lines and X point), and the 2002 October 3 flare (dark gray lines and cross point).
Current usage metrics show cumulative count of Article Views (full-text article views including HTML views, PDF and ePub downloads, according to the available data) and Abstracts Views on Vision4Press platform.
Data correspond to usage on the plateform after 2015. The current usage metrics is available 48-96 hours after online publication and is updated daily on week days.
Initial download of the metrics may take a while.