Fig. 3
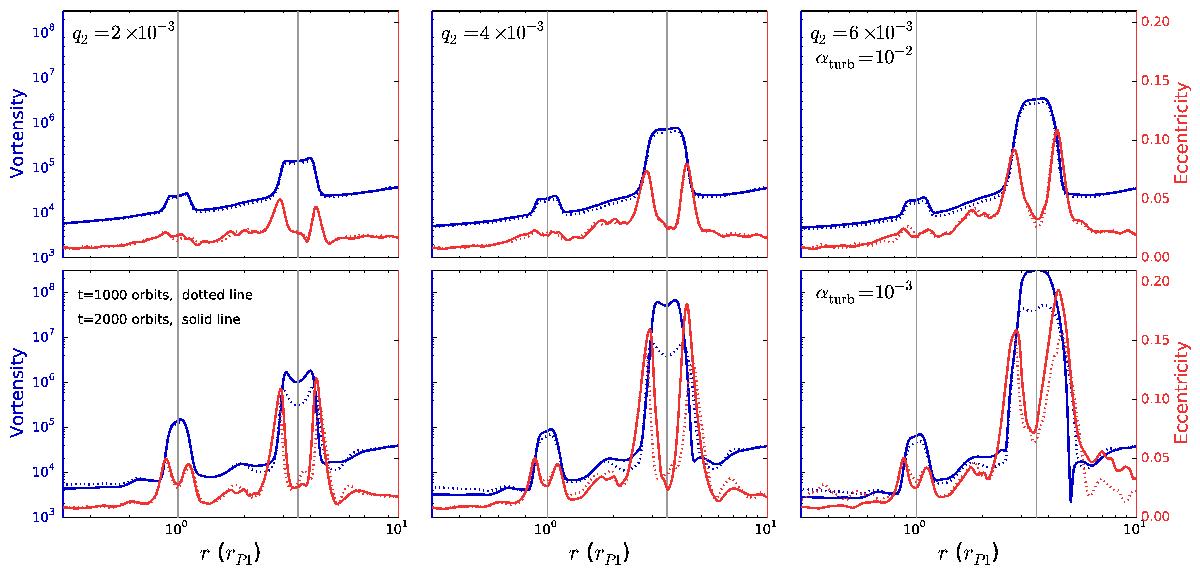
Azimuthally averaged vortensity ⟨ η2D ⟩ φ (blue lines) and disk eccentricity (red lines) versus the disk radial extension for the hydrodynamical simulations of Fig. 2 after 1000 (dotted lines) and 2000 (solid lines) orbits. The vertical lines correspond to the positions of the two planets.
Current usage metrics show cumulative count of Article Views (full-text article views including HTML views, PDF and ePub downloads, according to the available data) and Abstracts Views on Vision4Press platform.
Data correspond to usage on the plateform after 2015. The current usage metrics is available 48-96 hours after online publication and is updated daily on week days.
Initial download of the metrics may take a while.