Fig. 3
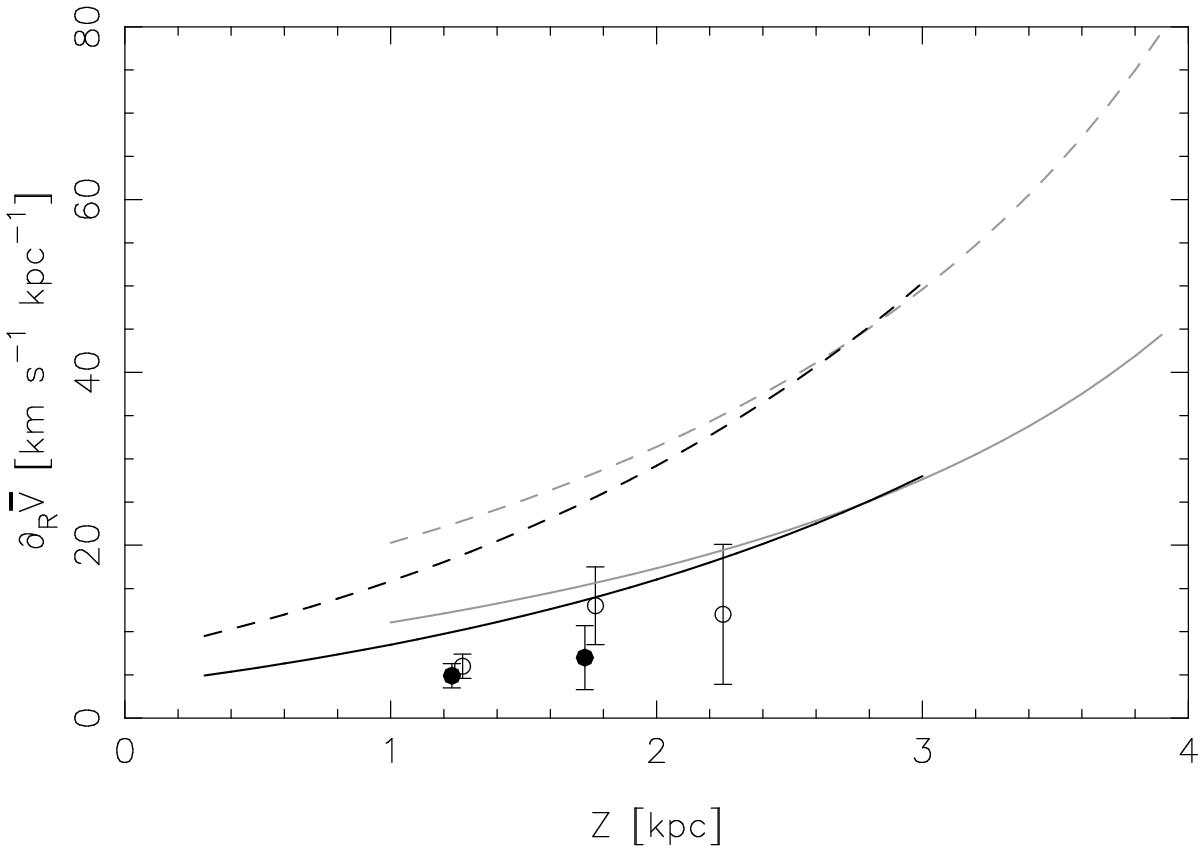
Vertical trend of ![]() expected by the hypothesis IR(Z) = 0, assuming the M12b (full curves) and BT12 (dashed curves) parameter set, and the kinematical results of (Casetti-Dinescu et al. 2011; black curves) and M12a (gray curves). The measurements of Casetti-Dinescu et al. (2011) are shown as empty dots, and their revision discussed in Sect. 2.2.1 is indicated by full dots.
expected by the hypothesis IR(Z) = 0, assuming the M12b (full curves) and BT12 (dashed curves) parameter set, and the kinematical results of (Casetti-Dinescu et al. 2011; black curves) and M12a (gray curves). The measurements of Casetti-Dinescu et al. (2011) are shown as empty dots, and their revision discussed in Sect. 2.2.1 is indicated by full dots.
Current usage metrics show cumulative count of Article Views (full-text article views including HTML views, PDF and ePub downloads, according to the available data) and Abstracts Views on Vision4Press platform.
Data correspond to usage on the plateform after 2015. The current usage metrics is available 48-96 hours after online publication and is updated daily on week days.
Initial download of the metrics may take a while.