Fig. 7
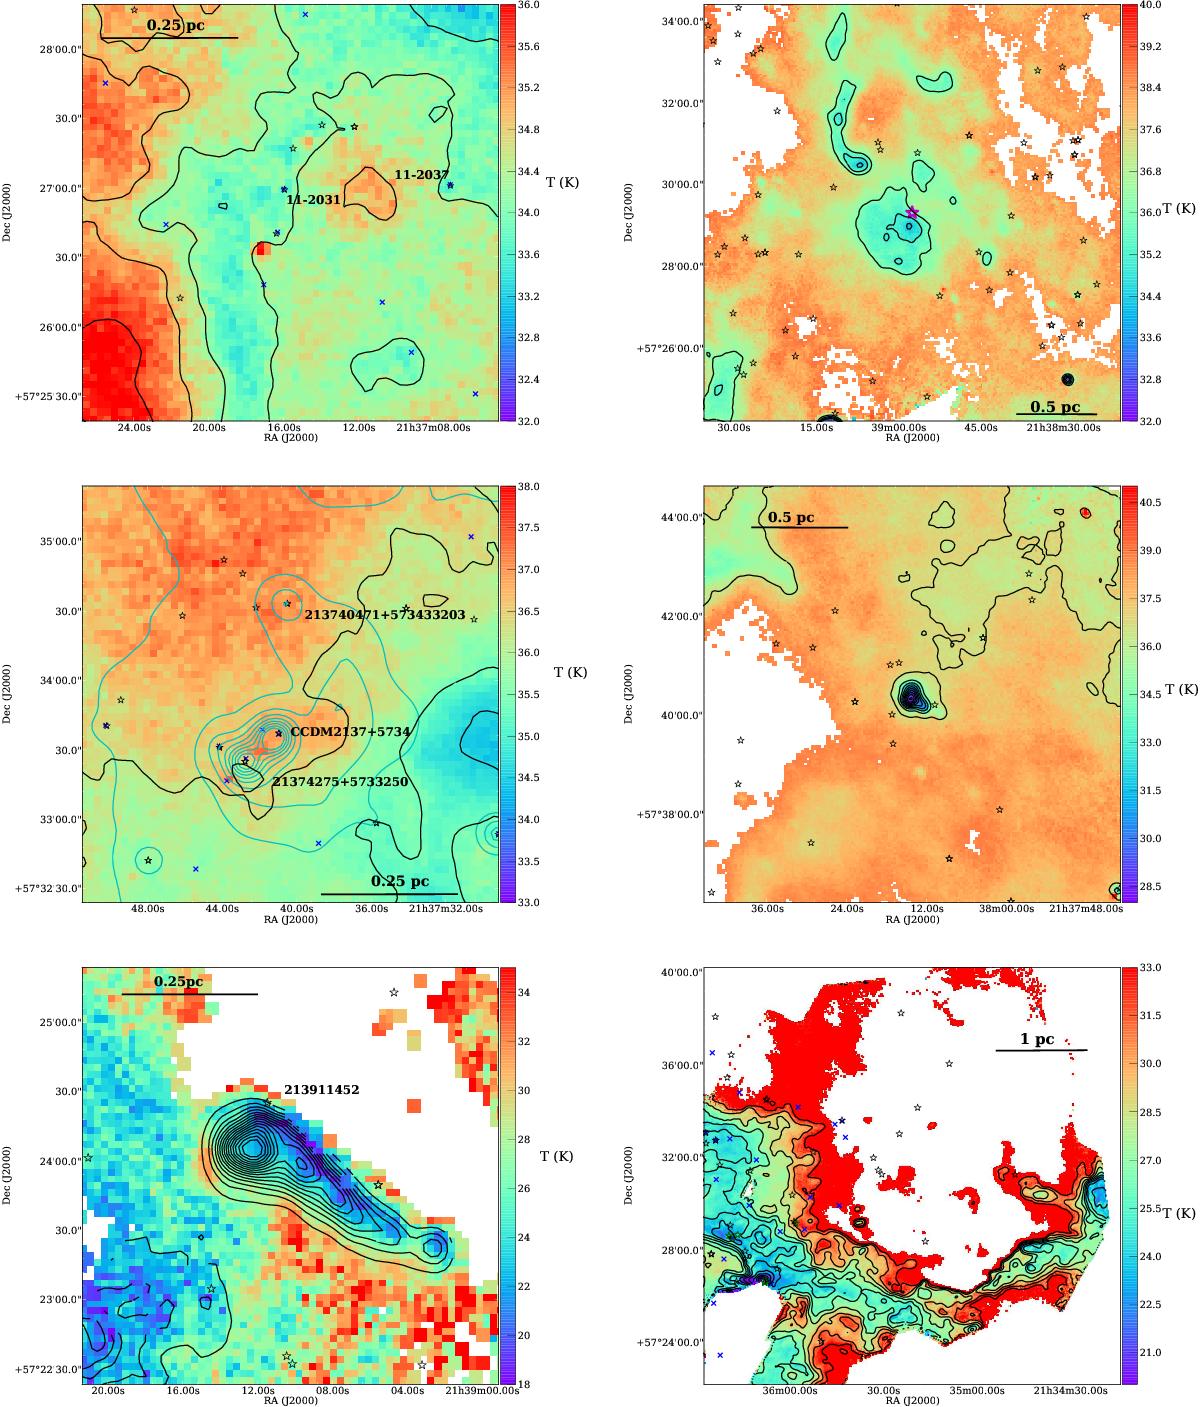
Approximate temperature maps derived from the Herschel/PACS data for the mini-clusters (left column, top to bottom, mini-clusters associated with: 11-2031, CCDM J2137+5734, and 213911452+572425205) and the centtr, north, and west of Tr 37 (right column, from top to bottom). The NH column density contours are plotted in black. For the CCDM J2137+5734 mini-cluster, whose structure is not detected by Herschel, we also plot the MIPS 24 μm contours (cyan). The temperature and column density scales are different for each region to show the fine structure. A temperature scale is attached to each plot. The NH contours have been adjusted to each region, and correspond to linear spacing between 2e+20-3e+20 cm-2 (for the 11-2031 and CCDM J2137+5734 mini-clusters, the Tr 37 centre map), 1e+20-1.5e+21 cm-2 (for the 213911452 mini-cluster and the Tr 37 north map), and a log scale between 1e+20-1e+23 cm-2 (for the Tr 37 west map). For the 11-2031 mini-cluster, NH increases towards the centre of the filament (centre of the image). For CCDM J2137+5734, NH increases towards the south-west, as the mini-cluster itself does not present any detectable overdensity with respect to the local background. Confirmed cluster members (with and without disks) are marked with stars, X-ray sources consistent with YSO are marked withs crosses. The O6.5 star HD 206267 is marked as a large magenta star in the cluster centre. Noise-dominated regions are excluded from the plots. Note that the temperature/column density derivation is only valid in regions that are optically thin, and thus not relevant in very dense parts or in pixels dominated by stellar emission.
Current usage metrics show cumulative count of Article Views (full-text article views including HTML views, PDF and ePub downloads, according to the available data) and Abstracts Views on Vision4Press platform.
Data correspond to usage on the plateform after 2015. The current usage metrics is available 48-96 hours after online publication and is updated daily on week days.
Initial download of the metrics may take a while.