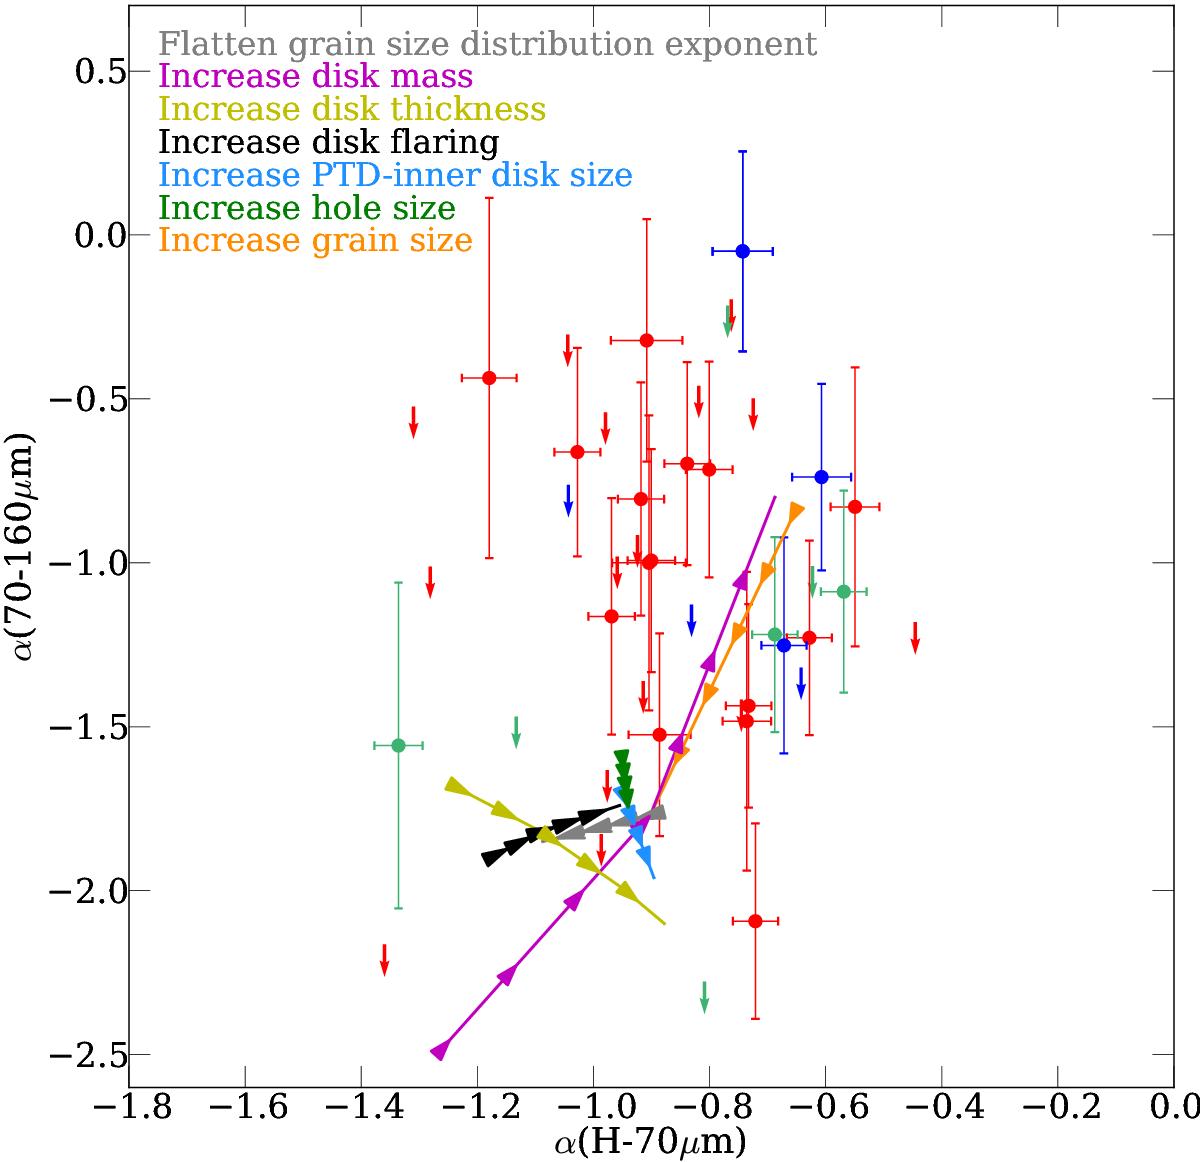
Fig. 5

Observed SED spectral indices α (including 160 μm) and predicted trends from the models in Fig. 3. Detections are marked as dots with errorbars (red for full disks, blue for PTD, green for TD), and upper limits are shown as arrows. We only consider disks detected at 70 μm and with no evidence of nebular/extended emission at 160 μm. The thick lines show the variation of the spectral indices when the disk properties are changed.
Current usage metrics show cumulative count of Article Views (full-text article views including HTML views, PDF and ePub downloads, according to the available data) and Abstracts Views on Vision4Press platform.
Data correspond to usage on the plateform after 2015. The current usage metrics is available 48-96 hours after online publication and is updated daily on week days.
Initial download of the metrics may take a while.


