Fig. 4
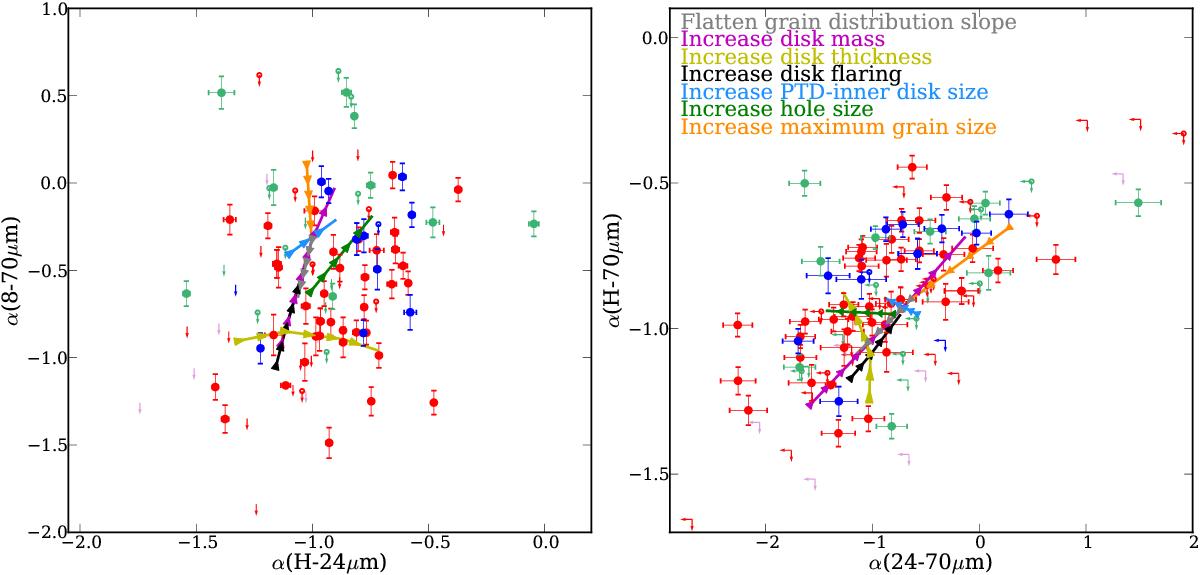
Mid- and far-IR SED spectral indices for stars with different disk types, classified according to their Spitzer colours. Note the degeneracy that arises between different disk structures when only simple diagrams are considered. Full disks are marked in red, PTD are marked in blue, TD are marked in green, and low excess/depleted disks are marked in pink. Circles represent detections and left/downwards pointing arrows are upper limits. Marginal detections are marked as upper limits with an additional open circle. We only include upper limits for stars with spectral types K7 or earlier, given that the data are very incomplete for M-type stars. The SED spectral indices for the models in Fig. 3 are shown as continuous lines, with arrows marking the direction of the change when various disk properties are modified (see legend).
Current usage metrics show cumulative count of Article Views (full-text article views including HTML views, PDF and ePub downloads, according to the available data) and Abstracts Views on Vision4Press platform.
Data correspond to usage on the plateform after 2015. The current usage metrics is available 48-96 hours after online publication and is updated daily on week days.
Initial download of the metrics may take a while.