Fig. 10
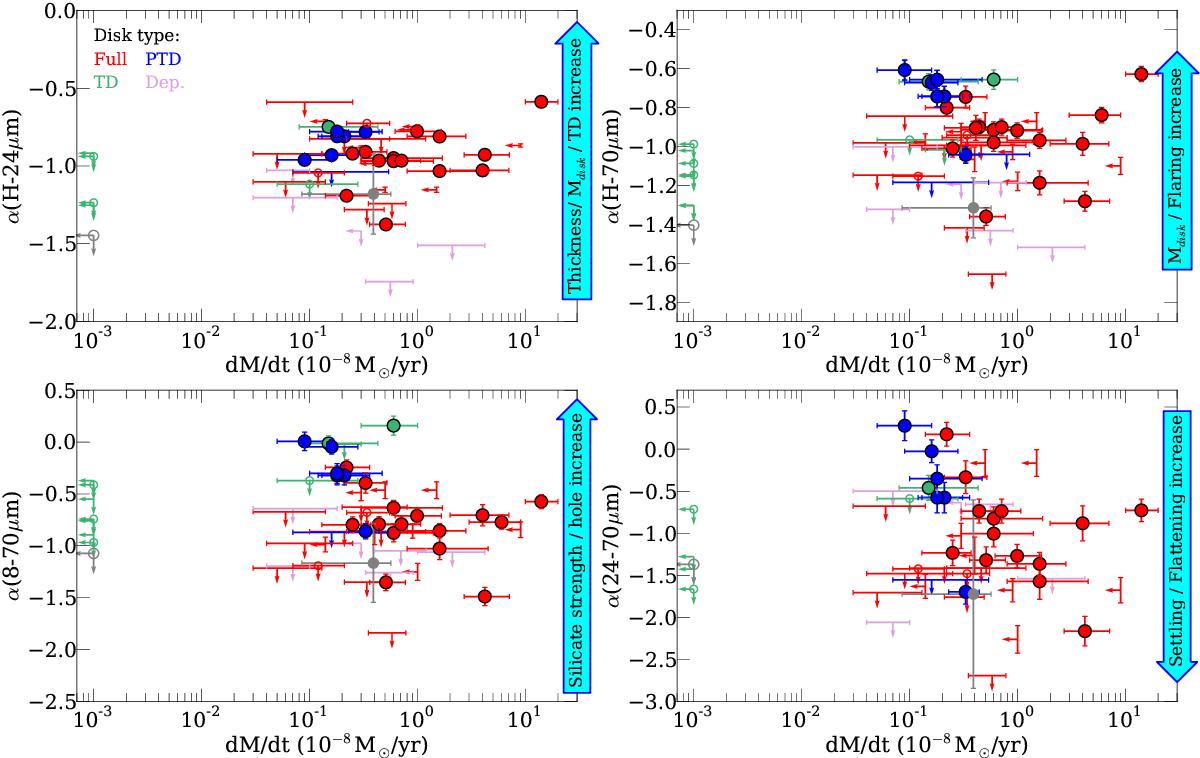
The spectral indices α involving far-IR colours vs. accretion rates for stars with different disk types, classified according to their Spitzer colours (see text). Full disks are marked in red, PTD are marked in blue, TD are marked in green, and low excess/depleted disks are marked in pink. Circles represent detections (in both photometry and accretion rate), and upper limits in the accretion rate or spectral indices are marked by arrows. Marginal detections are marked with arrows, but we also show an open circle at the marginal value. The solid grey dot corresponds to the median value obtained by stacking the images of the non-detected objects. Its errorbars represent the dispersion in the α index and the quartiles in the accretion rate. The open grey dot is the median value (marginal detection) obtained by stacking the non-accreting disks. On the right, blue arrows show how certain changes in the disk properties would affect the observed spectral indices, as explored in Sect. 3.2.
Current usage metrics show cumulative count of Article Views (full-text article views including HTML views, PDF and ePub downloads, according to the available data) and Abstracts Views on Vision4Press platform.
Data correspond to usage on the plateform after 2015. The current usage metrics is available 48-96 hours after online publication and is updated daily on week days.
Initial download of the metrics may take a while.