Fig. 1
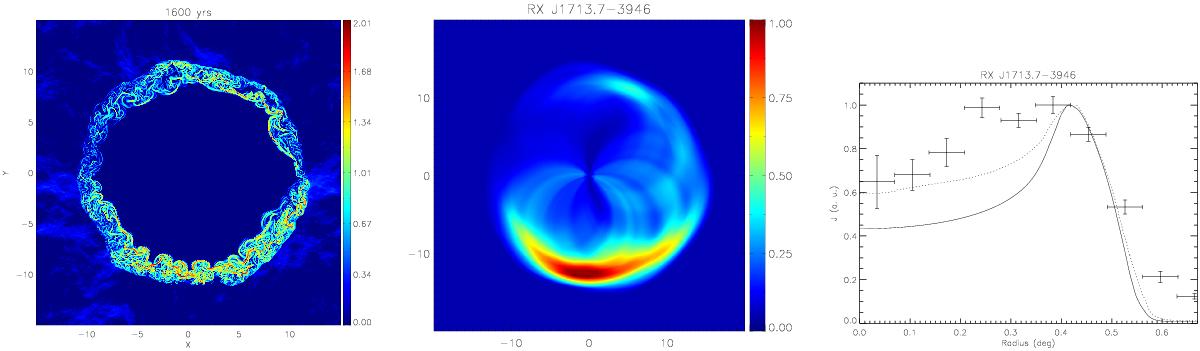
Left: structure of the magnetic field B in units of μG at 1600 years of a test run with n0 = 0.04 cm-3. The rest of the model parameters are shown in the text. Middle: TeV image derived from the 2D MHD simulation. The image has been normalized to its peak value. Right: comparison of the observed radial profile averaged along the azimuthal direction with results (solid line) derived from the 2D MHD simulation. The dotted line is obtained by averaging the radial brightness profiles obtained in the position angle range of 0.7π to 0.95π in the middle panel.
Current usage metrics show cumulative count of Article Views (full-text article views including HTML views, PDF and ePub downloads, according to the available data) and Abstracts Views on Vision4Press platform.
Data correspond to usage on the plateform after 2015. The current usage metrics is available 48-96 hours after online publication and is updated daily on week days.
Initial download of the metrics may take a while.