Fig. 9
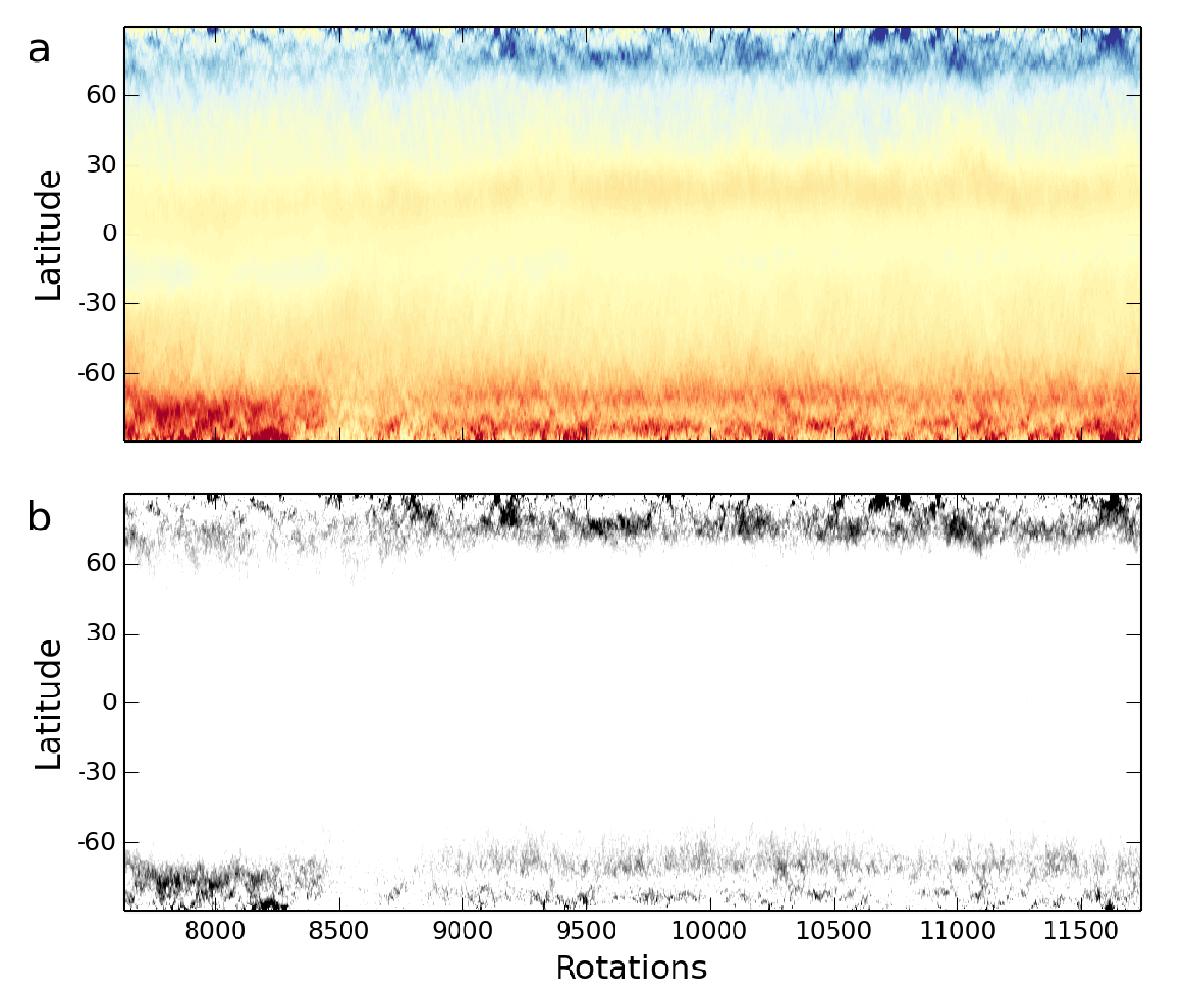
Panel a) shows the azimuthally averaged radial magnetic field on the outer boundary of model A-Pr10-N5 (colour map similar to Fig. 3d). Panel b) highlights magnetic-field-induced dark regions on the outer boundary. The latter were constructed by calculating the azimuthally averaged relative heat flux (sampled in Fig. 3f) for the simulation and plotting data that were lower than unity.
Current usage metrics show cumulative count of Article Views (full-text article views including HTML views, PDF and ePub downloads, according to the available data) and Abstracts Views on Vision4Press platform.
Data correspond to usage on the plateform after 2015. The current usage metrics is available 48-96 hours after online publication and is updated daily on week days.
Initial download of the metrics may take a while.