Fig. 11
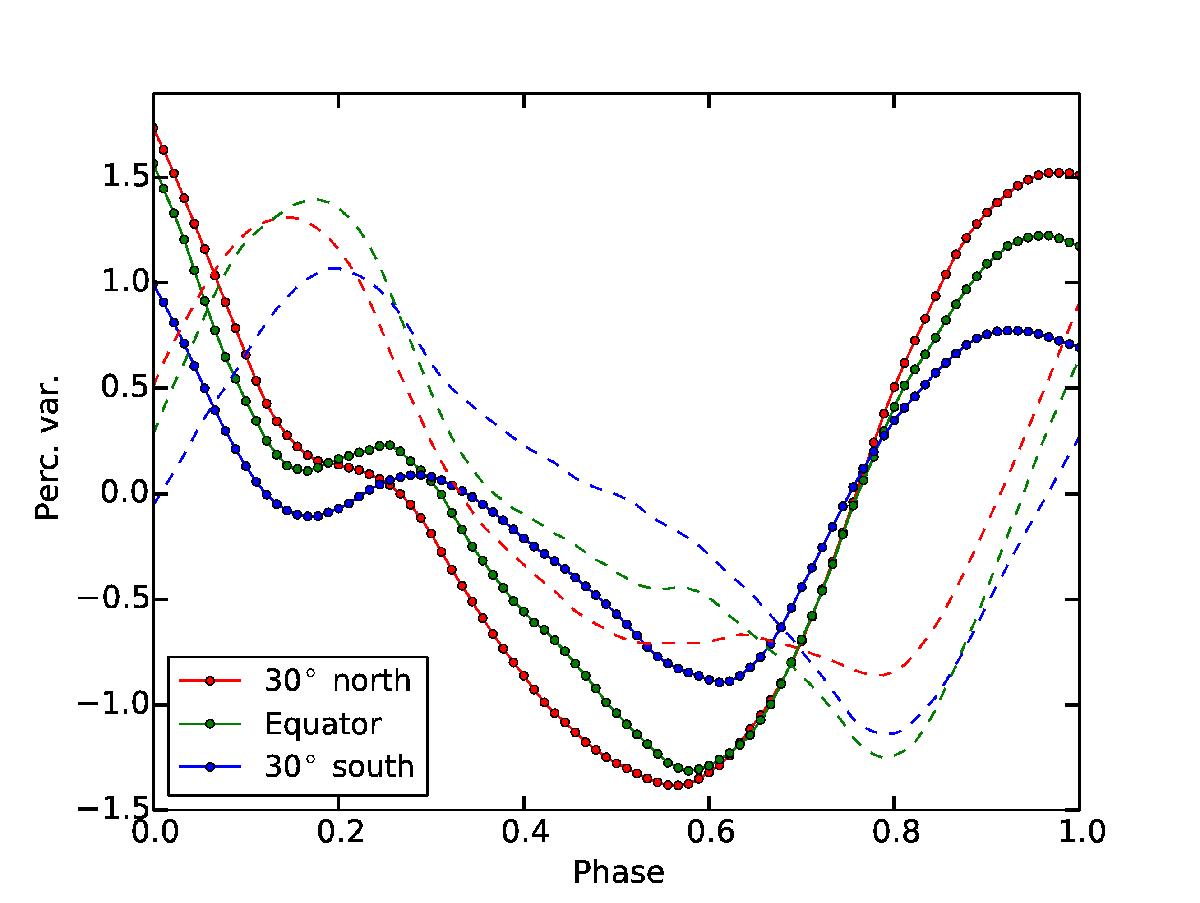
Synthetic light curves calculated using the heat flux emanating from the outer boundary of a simulation. Pearled curves depict model A-Pr10-N5, dashed curves the hydrodynamic model H-Pr10-N5. Light-curves are given for three different inclinations: line of sight 30° north of the equator (red), in the equatorial plane (green), and 30° south of the equator (blue). The amplitude is in terms of percentage variations about the mean.
Current usage metrics show cumulative count of Article Views (full-text article views including HTML views, PDF and ePub downloads, according to the available data) and Abstracts Views on Vision4Press platform.
Data correspond to usage on the plateform after 2015. The current usage metrics is available 48-96 hours after online publication and is updated daily on week days.
Initial download of the metrics may take a while.