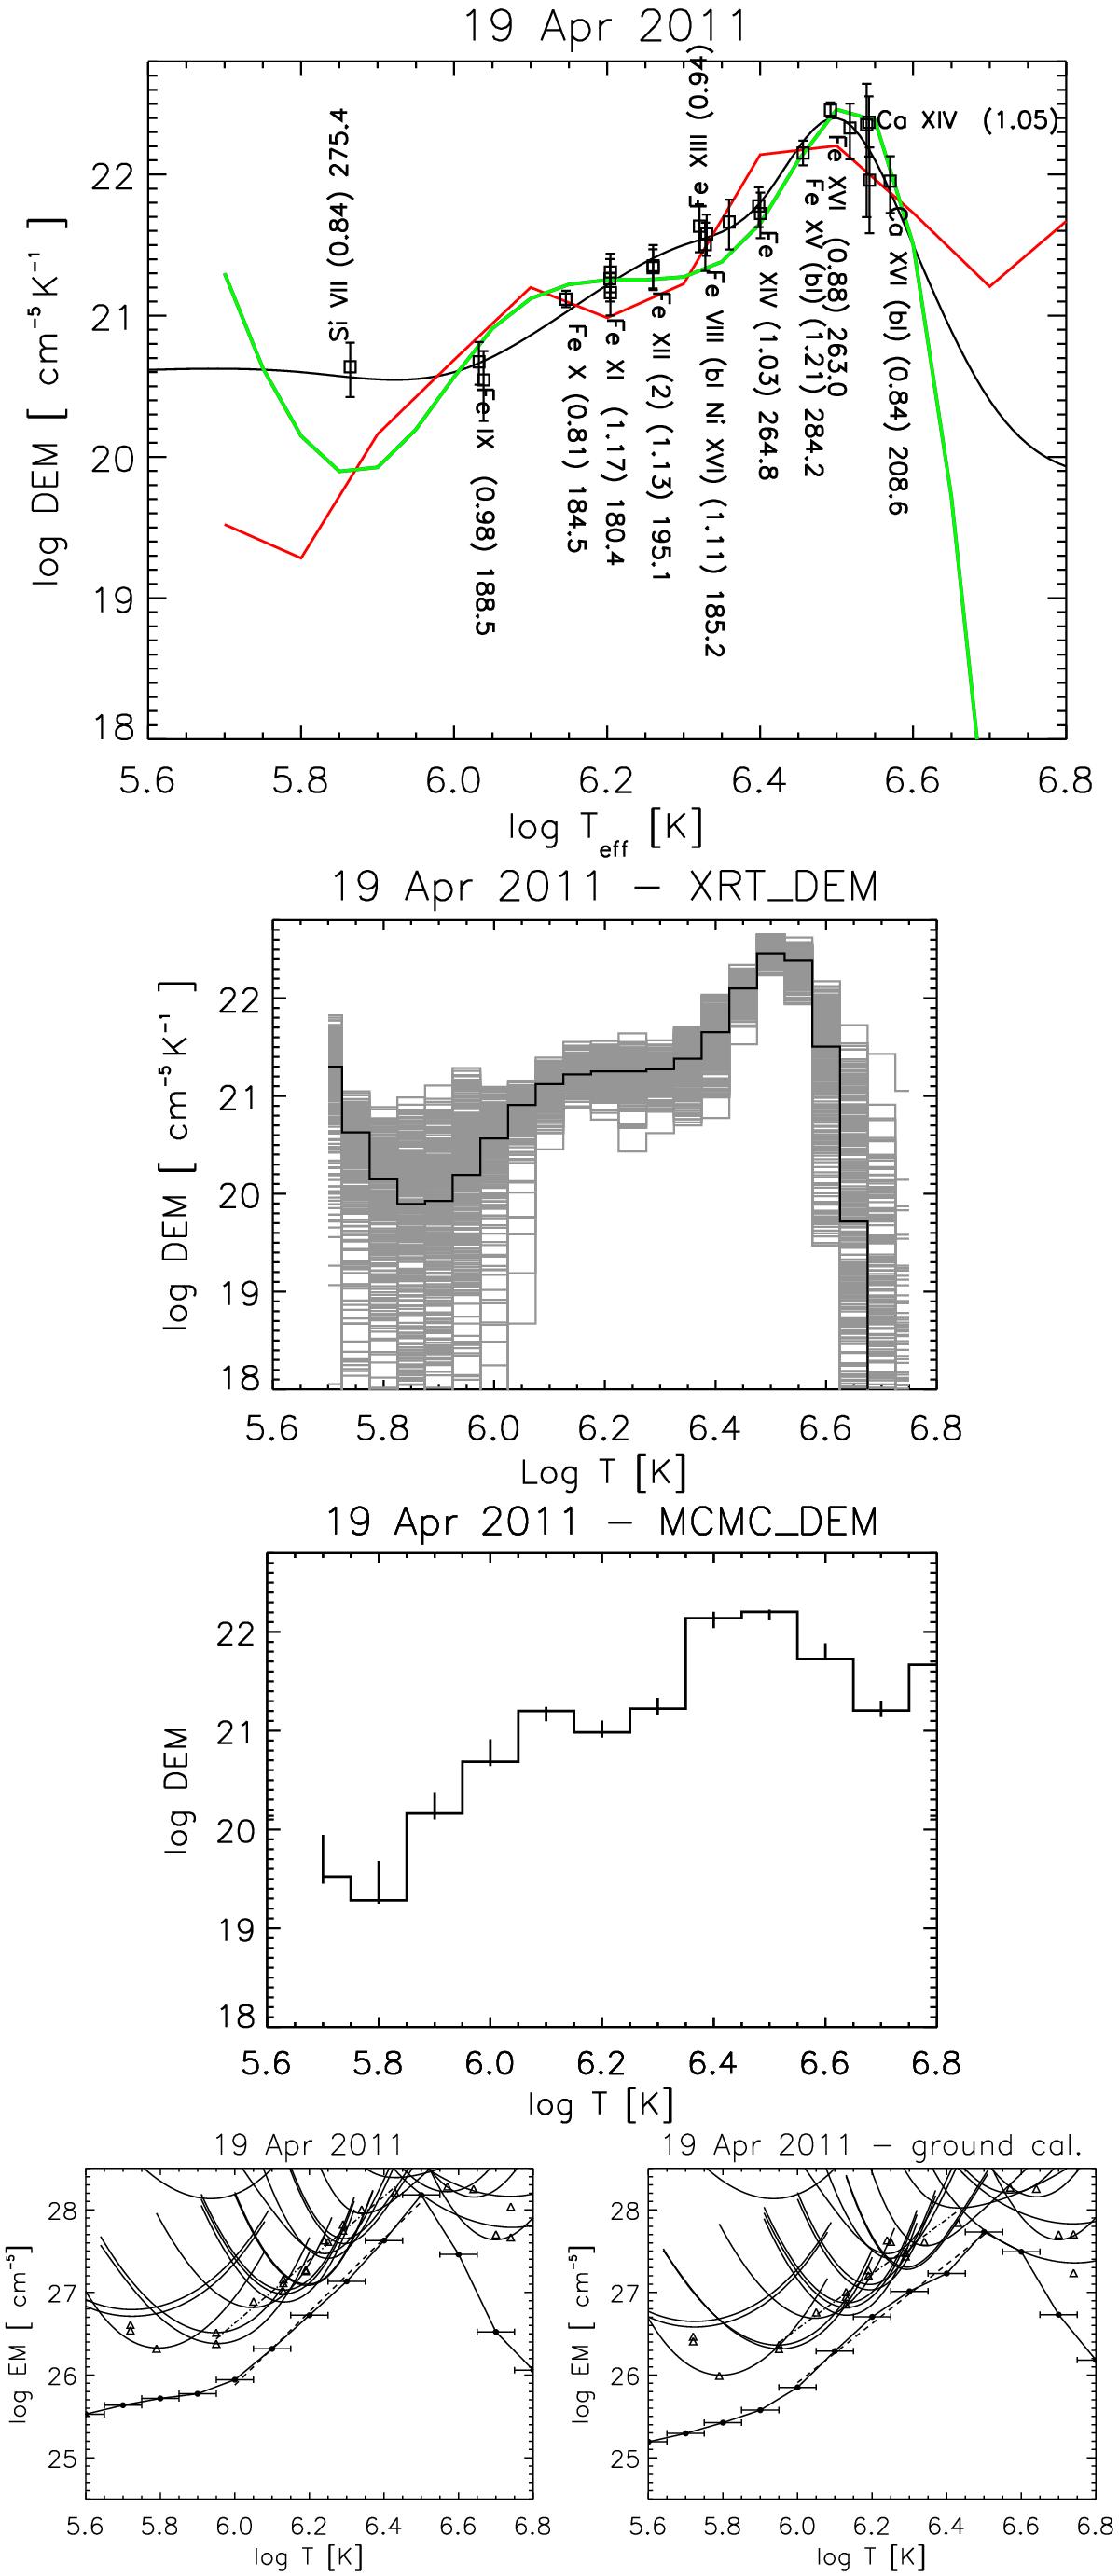
Fig. 6

From top to bottom: 1) DEM for the 19 Apr. AR core, obtained with the spline method (black smooth curve), with the MCMC_DEM program (red curve) and XRT_DEM method (green curve). The points are plotted at their effective temperature, and the values in brackets indicate the ratio between predicted and observed intensity. 2) The results of the Monte Carlo XRT_DEM inversion. 3) The DEM obtained from MCMC_DEM. 4) The EM(0.1) values obtained from the DEM, together with the curves for the EM loci, and the slopes (dashed lines). The EMjw points (triangles) are also shown, with their slopes (dot-dash lines). The left bottom plot is with the new Hinode EIS calibration (slope = 4.4 from the EM(0.1) and 3.8 from the EMjw points), the right one with the ground calibration (slope = 3.6 from the EM(0.1) and 3.3 from the EMjw points).
Current usage metrics show cumulative count of Article Views (full-text article views including HTML views, PDF and ePub downloads, according to the available data) and Abstracts Views on Vision4Press platform.
Data correspond to usage on the plateform after 2015. The current usage metrics is available 48-96 hours after online publication and is updated daily on week days.
Initial download of the metrics may take a while.


