Fig. 7
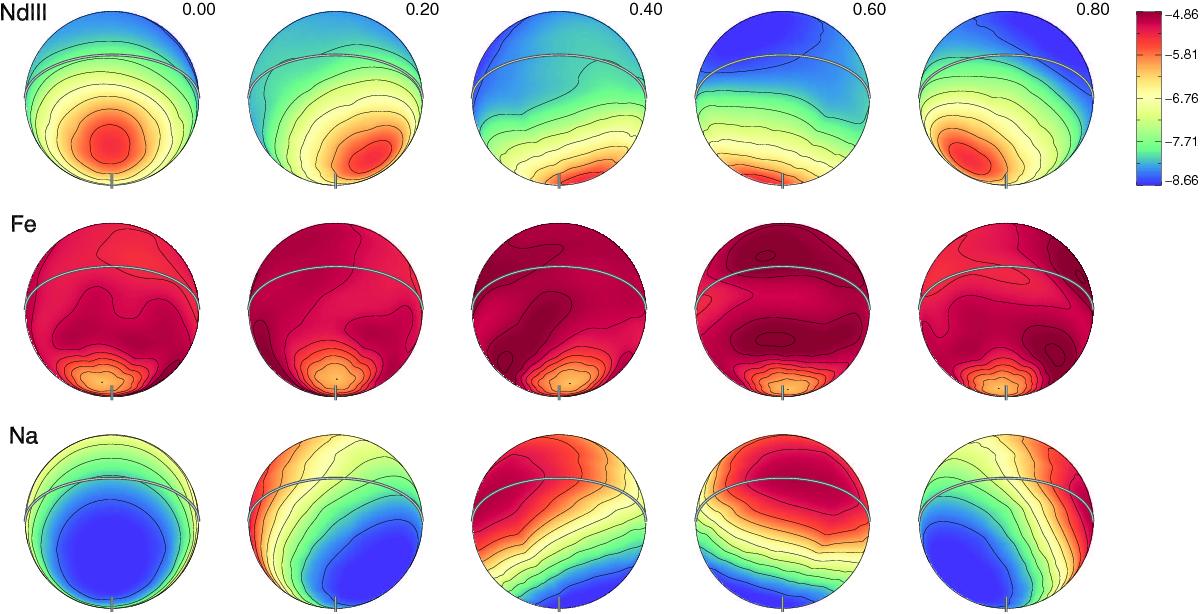
Abundance distribution of Nd iii, Fe, and Na on the surface of HD 24712. The first row shows the surface map of the Nd iii, the second and third rows illustrate the surface abundance maps of Fe and Na. These maps were derived from the simultaneous mapping of the three elements. The bars on the right next to each panel indicate the abundance in log (NX/Ntot) units of element X. The contours are plotted with a step of 0.4 dex Nd iii and Na, and 0.2 dex for Fe. The vertical bar indicates the rotation axis.
Current usage metrics show cumulative count of Article Views (full-text article views including HTML views, PDF and ePub downloads, according to the available data) and Abstracts Views on Vision4Press platform.
Data correspond to usage on the plateform after 2015. The current usage metrics is available 48-96 hours after online publication and is updated daily on week days.
Initial download of the metrics may take a while.