Fig. 6
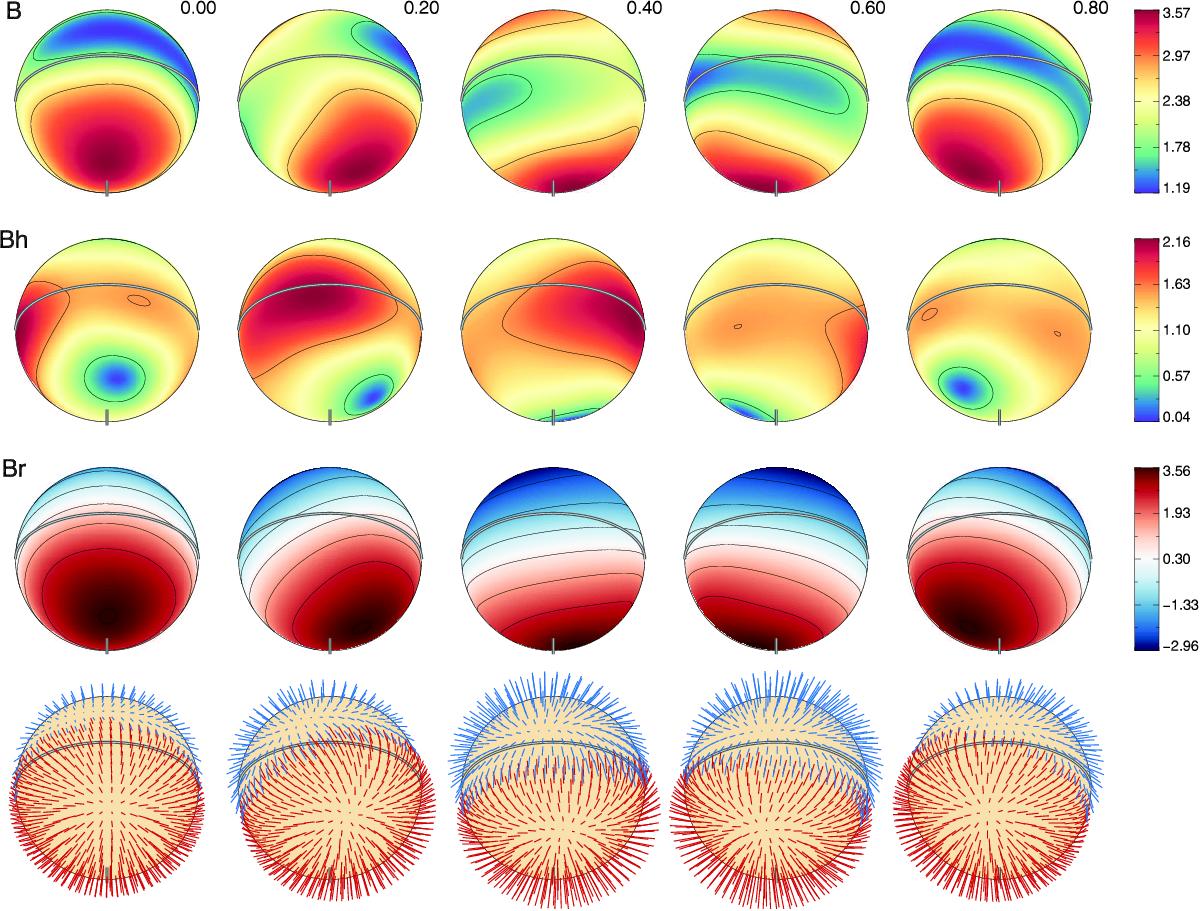
Distribution of the magnetic field on the surface of HD 24712 derived from simultaneous MDI analysis of Fe, Nd iii, and Na. The plots show the distribution of magnetic field modulus (first row), horizontal field (second row), radial field (third row), and field orientation (fourth row) on the surface of HD 24712. The bars on the right indicate the field strength in kG. The contours are plotted in steps of 1 kG. The arrow length in the bottom plot is proportional to the field strength. The star is shown at five rotational phases, indicated above the spherical plots.
Current usage metrics show cumulative count of Article Views (full-text article views including HTML views, PDF and ePub downloads, according to the available data) and Abstracts Views on Vision4Press platform.
Data correspond to usage on the plateform after 2015. The current usage metrics is available 48-96 hours after online publication and is updated daily on week days.
Initial download of the metrics may take a while.