Fig. 3
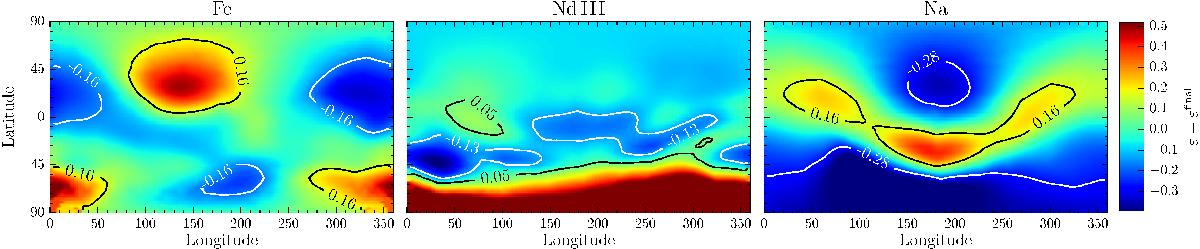
Differences in the abundance distribution of Fe, Nd iii, and Na from their individual mapping relative to the corresponding maps from the simultaneous MDI of these elements. We note that for Na mapping we used the magnetic field maps derived from the simultaneous MDI inversion of the Fe and Nd iii lines. In each panel we mark the 16 and 84 percentiles with white and black lines. The bar on the right indicates the abundance difference in log (NX/Ntot) units of element X.
Current usage metrics show cumulative count of Article Views (full-text article views including HTML views, PDF and ePub downloads, according to the available data) and Abstracts Views on Vision4Press platform.
Data correspond to usage on the plateform after 2015. The current usage metrics is available 48-96 hours after online publication and is updated daily on week days.
Initial download of the metrics may take a while.