Fig. 2
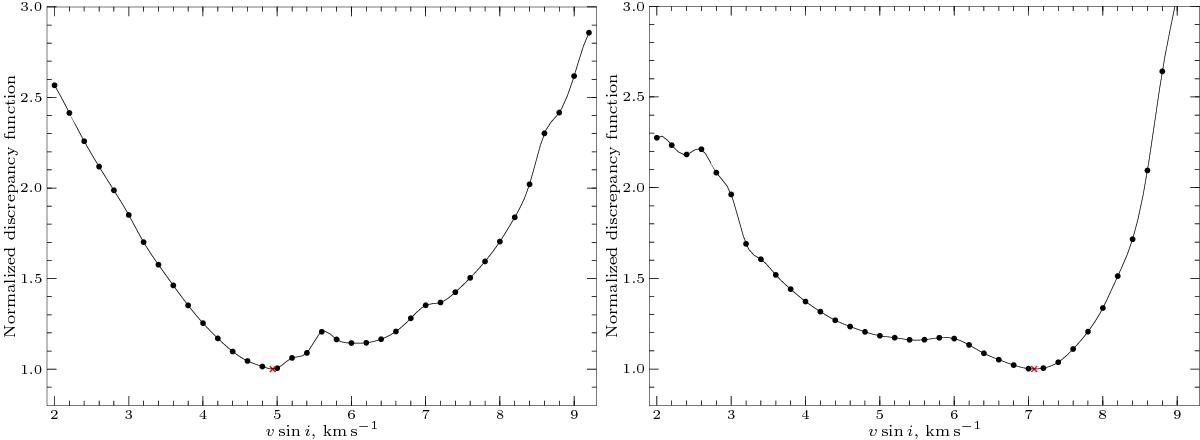
Normalized discrepancy function ![]() for the iron lines (left panel) and for the neodymium lines (right panel) as a function of projected equatorial velocity vesini (symbols). The solid curve is an interpolating cubic spline used to find the minimum of the discrepancy functions. The × symbol on the plot marks the position of the minimum.
for the iron lines (left panel) and for the neodymium lines (right panel) as a function of projected equatorial velocity vesini (symbols). The solid curve is an interpolating cubic spline used to find the minimum of the discrepancy functions. The × symbol on the plot marks the position of the minimum.
Current usage metrics show cumulative count of Article Views (full-text article views including HTML views, PDF and ePub downloads, according to the available data) and Abstracts Views on Vision4Press platform.
Data correspond to usage on the plateform after 2015. The current usage metrics is available 48-96 hours after online publication and is updated daily on week days.
Initial download of the metrics may take a while.